Physics307L F08:People/Smith/Notebook/5
Lab 5: Millikan Oil Drop
Lab partner: Kyle Martin
Purpose
To experimentally determine the value of the electric charge and to confirm the quantization of charge.
Equipment
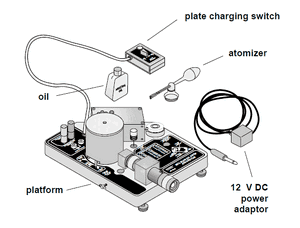
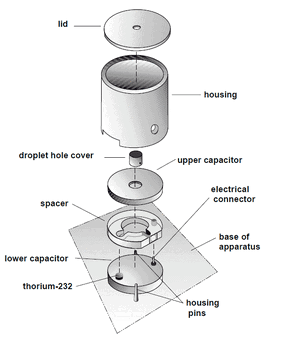
Refer to the PASCO manual.
- 500 Volt DC power supply for applying a potential across the plates of the oil drop chamber
- Mineral oil (also, disgustingly, labeled as "intestinal lubricant"), Squib #5597
- Atomizer for spraying mineral oil into chamber
- Multimeter capable of measuring ohmic resistance around 2 megaohms and DC voltage in the range of 500 volts
- Stopwatch
- Millikan oil drop apparatus (PASCO scientific Model AP-8210). Refer to manual for complete description.
- Banana connectors
- DC power supply for halogen light source on Millikan oil drop apparatus
Setup
As described in PASCO manual:
- Measure the thickness of the plastic spacer which separates the two brass plates in the chamber of the apparatus using a micrometer.
- Connect 500 V power supply to the terminals of the plates in the Millikan oil drop apparatus and measure voltage with
- Connect halogen light source power supply.
- Measure thermistor resistance in order to gauge the temperature of the chamber in the apparatus.
- Fill atomizer with Squib #5597
intestinal lubricantmineral oil. - Level oil drop apparatus using the bubble leveler.
- Adjust halogen lamp position as necessary. The desired position becomes clearer as the experiment progresses.
- Focus viewing scope on apparatus using the focusing wire.
Setup Measurements and Known Values
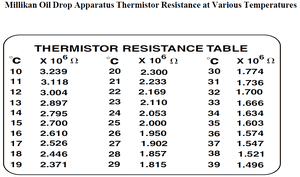
- Thermistor resistance: [math]\displaystyle{ R = 2.387\; M \Omega }[/math], which implies temperature [math]\displaystyle{ T = 18.4 ^{\circ}\;C }[/math], as per temperature table on apparatus.
- To get this number, I input the values of the Temperature vs. Resistivity chart found in the manual (Appendix B, also shown to the right) into Excel, found a polynomial equation which roughly represents the curve and plugged in a resistance of 2.387 MegaOhms.
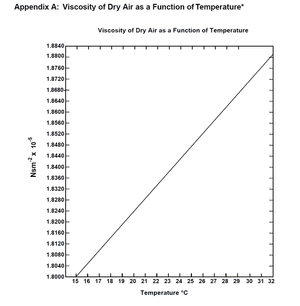
- According to Appendix A (shown to the right) of the manual, at a temperature of 18.4°C the viscosity of dry air is [math]\displaystyle{ \eta = 1.816 \times 10^{-5} \frac{Ns}{m^2} }[/math] or [math]\displaystyle{ Pa\cdot s }[/math].
- To find this value, I used a digitizer (called Engauge) on an image file I made of Appendix A which output a few data points. I put these data points into Excel and found a linear equation to describe the curve. I plugged 18.4°C into this equation to get the result listed above.
- Spacer thickness: [math]\displaystyle{ d = 7.59\;mm = 7.59 \times 10^{-3}\;m }[/math]
- Oil density: [math]\displaystyle{ \rho = 886 \;\frac{kg}{m^3} }[/math]
- Barometric Pressure: [math]\displaystyle{ P = 1.0 \times 10^5\;Pa }[/math] (see Weather Underground Archives)
- Gravitational Acceleration: [math]\displaystyle{ g = 9.8\;\frac{m}{s^2} }[/math]
- Some constant for determining radius of drop in m: [math]\displaystyle{ b = 8.20 \times 10^{-3}\; Pa \cdot m }[/math]
Procedure
Spray oil into the top hole of the chamber on the apparatus using an atomizer. It might be necessary to turn the lever on the side of the chamber to the "spray position"; make sure to turn this lever back to the "off" position after spraying.
Note: Squeeze the bulb of the atomizer while the nozzle is in the top hole, and then remove the nozzle and release the bulb. Releasing the bulb while the nozzle is in the hole will suck up oil from the chamber - which might be desired if there are too many droplets visible in the viewing scope.
Using the viewing scope, pick out an oil drop to follow. Apply voltage across the plates in the chamber to make sure this oil drop has a net charge (it will move in response to the applied electric field if it is; unfortunately, many of the oil drops visible in the viewing scope have no net electric charge and are therefore unsuitable for observation).
Ensure there is no potential applied across the plates. Using the stopwatch, measure the time it takes the oil drop to fall one major reticle square (this is 0.5mm). This time will be referred to as the "fall time" of the droplet.
Apply a potential across the plates such that the drop rises. The manual assumes that the top plate should be positively charged, meaning the oil drop has a negative net charge. This may not be the case; the oil drop might have a deficiency of electrons instead of a surplus. I don't think that this will matter too much, it will just make the drop fall instead of rise (or rise instead of fall) when the potential is applied. Dr. Koch demonstrated this when my lab partner and I were having trouble finding charged droplets (we had many, many droplets with no net charge on them; I don't know why we had so many, and I haven't found other people had this problem in reading my classmates' notebooks). Measure the time it takes for the oil drop to rise one major reticle square (0.5mm) with the stopwatch.
Data
Please refer to my Excel spreadsheet for Data and Analysis.
| Oil Drop | Fall Time (sec) | Rise Time (sec) |
|---|---|---|
| 1 | 72.78 | 3.64 |
| 2 | 43.62 | 1.8 |
| 3 | 35.37 | 0.71 |
| 4 | 25.36 | 2.61 |
| 4 | 24.25 | 3 |
| 5 | 30.53 | 4.93 |
| 5 | 31.98 | 5 |
| 6 | 30.08 | 4.33 |
| 6 | 58.87 | 4.3 |
| 7 | 12.8 | 3.2 |
| 7 | 12.56 | 3.05 |
| 8 | 33.09 | 4.58 |
| 8 | 41.59 | 4.89 |
| 8 | 46.86 | 4.48 |
| 9 | 19.52 | 1.36 |
| 9 | 36 | 3.21 |
| 10 | 29.58 | 6.09 |
| 11 | 33 | 5.23 |
| 11 | 46.52 | 5.17 |
| 11 | 40.63 | 5.28 |
| 12 | 49.5 | 3.55 |
| 12 | 75.23 | 4.02 |
| 13 | 60.52 | 1.25 |
| 14 | 19.34 | 11.71 |
| 14 | 33.25 | 4.84 |
| 14 | 22.86 | 0.95 |
| 15 | 22.58 | 10.52 |
| 15 | 18.05 | 12.61 |
| 15 | 18.42 | 13.59 |
| 15 | 17.65 | 12.96 |
| 15 | 15.9 | 13.21 |
| 16 | 17.31 | 3.28 |
| 17 | 45.02 | 2.11 |
| 18 | 39.46 | 4.18 |
| 18 | 60.27 | 3.96 |
| 18 | 99.5 | 3.78 |
Analysis
Please refer to my Excel spreadsheet for Data and Analysis.
The manual gives the equation [math]\displaystyle{ q=\frac{mg(v_f+v_r)}{Ev_f} }[/math], which is derived from the forces acting upon the oil droplet in an electric field. In our case, we know that the electric field is 66271 volts per meter, as our plates are charged to 503 volts and are separated by 7.59 mm.
In the mid 19th century, George G. Stokes (of Navier-Stokes fame) derived some equations about small spherical objects in fluid. Using his equations, with some small correctional factors since our droplets are on the order of a few microns, we can determine the radius of our droplet. The correctional factors are needed because the mean free path of air is on the order of a few microns, as well, which violates one of Stokes' assumptions. Since we also know the density of our mineral oil, we can estimate the mass of our droplets based solely on the fall times.
- Stokes's Law is [math]\displaystyle{ a=\sqrt{\left(\frac{9 \eta v_f}{2g\rho}\right)} }[/math], where a is the radius of our sphere, [math]\displaystyle{ \eta }[/math] is the viscosity of the fluid (air, in our case), [math]\displaystyle{ v_f }[/math] is the fall velocity, g is the gravitational constant, and [math]\displaystyle{ \rho }[/math] is the density of the sphere.
However, our correctional factor comes into play as follows: [math]\displaystyle{ \eta_{eff} = \eta \left(\frac{1}{1+\frac{b}{pa}}\right) }[/math] (where b is the constant [math]\displaystyle{ 6.17\times10^{-4} }[/math] and p is the barometric pressure in pascals), and we should use [math]\displaystyle{ \eta_{eff}\; }[/math] in place of [math]\displaystyle{ \eta\; }[/math].
- Combining Stokes' Law, the density of our mineral oil, and the first equation, we've got [math]\displaystyle{ q=\left[ 400 \pi d \left( \frac{1}{g\rho} \left( \frac{9\eta}{2} \right) ^3\right) ^{\frac{1}{2}} \right] \times \left[ \left( \frac{1}{1+\frac{b}{pa}} \right) ^{\frac{3}{2}}\right] \times \left[ \frac{v_f + v_r \sqrt{v_f}}{V} \right] }[/math], where V is the voltage across the plates and d is the distance between them.
- Since it's reasonable to assume that the charge is constant for a single drop over several runs (though this may NOT be the case, as electrons might be ripped off of the drops, as Devon pointed out), we can take the average of their charges (estimated using the above equation). Sorting these charges in ascending order, as I've done in my Excel file, it appears that there are several "clusters" that you can see. There is a cluster of charges between about [math]\displaystyle{ (1.17-1.7)\times 10^{-19}\;C }[/math], one about [math]\displaystyle{ (2.8-3.85)\times 10^{-19}\; C }[/math], one about [math]\displaystyle{ (4.2-5.1)\times 10^{-19}\;C }[/math] and two more charges without close neighbors at [math]\displaystyle{ 7.7\times 10^{-19}\; C }[/math] and [math]\displaystyle{ 9.7\times 10^{-19}\; C }[/math].
- Since we know that charge is quantized (or, at least, we believe that it is; previous experimentation had led Millikan to believe this, as well - J.J. Thompson's "corpuscles" of negative charge), we might assume that the group (or cluster) with the most number of oil droplets in it is possibly the elementary charge and each larger group is an integer multiple of this elementary charge.
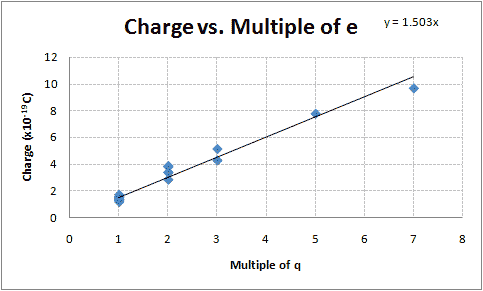
- The mean of group one is [math]\displaystyle{ 1.42 \times 10^{-19}\;C }[/math], the mean of group two is [math]\displaystyle{ 3.45 \times 10^{-19}\;C }[/math], the mean of group three is [math]\displaystyle{ 4.70 \times 10^{-19}\;C }[/math], the mean of group four is [math]\displaystyle{ 7.77 \times 10^{-19}\;C }[/math], the mean of group five is [math]\displaystyle{ 9.67 \times 10^{-19}\;C }[/math]. Group two is suspected to be 2e, group three is suspected to be 3e, group four is suspected to be 5e and group five is suspected to be 7e.
- Graphing these groups versus their suspected integer multiple of the elementary charge, as I did following examination of my lab partner's notebook (see F08:People/Martin/Millikan_Oil_Drop his summary), should yield a straight line, or something close (there will, of course, be some error with this, as the method of determining the charges of the oil droplet depends on the fall times and rise times which will not be entirely precise and because of Brownian motion.) Figure 1 demonstrates this.
Conclusions
The slope of the line fit using the least squares method while holding the y-intercept to be zero is [math]\displaystyle{ 1.50 \times 10^{-19}\;C }[/math], with an uncertainty of [math]\displaystyle{ 0.039 \times 10^{-19}\;C }[/math], making my best guess at the elementary charge to be [math]\displaystyle{ (1.50 \pm 0.039)\times 10^{-19}\;C }[/math]. This is 6.1% less than the accepted value of [math]\displaystyle{ 1.602\times 10^{-19}\;C }[/math].
Possible sources of error include Brownian motion (as the droplets of oil are very small), random errors associated with timing (delay between the droplet crossing the major reticle and the stopwatch button being pressed, etc.), losing track of the oil droplet through the viewing scope, uncertainties of the electric field, uncertainties of the temperature (unsteady resistance readings of the thermistor, or problems interpreting the resistance as a temperature), inaccuracies in the determination of the viscosity of air (the table is for dry air, what will the effect of humidity be?), uncertainties of the barometric pressure, inaccuracies of Stokes' Law (or the assumptions he made to derive the equation) and uncertainties of the density of our mineral oil.
Remarks
SJK 02:00, 19 November 2007 (CST)

I feel bad about this, but I was negligent in my writeup of this experiment and failed to give credit to my lab partner (Kyle Martin) for his great idea on how to crunch the data. Any and all credit for the method of plotting charge vs. suspected multiple of e- and finding the slope of the line fit using the least squares method should go to him. F08:People/Martin/Millikan_Oil_Drop See his summary.