Physics307L F08:People/Rivera/Notebook/Balmer Series
Balmer Series
Theory
SJK 00:41, 26 October 2007 (CDT)

Good description...it would probably be worth mentioning, though, that this involves electronic trnasitions, and the thus the quantum numbers.
I found a good explanation of the theory behind the Balmer series at Wikipedia-Balmer Series. I also found a good description of the Rydberg constant at Wikipedia-Rydberg Formula. Basically the Balmer series describes the spectral line emissions of hydrogen. The series can be calculated using the Balmer formula [math]\displaystyle{ \lambda=R*(\frac{1}{2^2}-\frac{1}{n^2}) }[/math]. R is the Rydberg constant and we will calculate it by manipulating the Balmer Formula to give [math]\displaystyle{ R=\frac{1}{\frac{\lambda}{4}-\frac{\lambda}{n^2}} }[/math]. The theory is that there is a specific value for R that will allow us to predict the wavelenght ([math]\displaystyle{ \lambda }[/math]) for each principle quantum number (n) for the hydrogen atom.
Set Up and Calibration
-
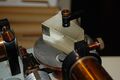 Prism held by pin needs to be adjusted by hand to align the spectral lines.
 -
![Adjustment dial used to change the value of [math]\displaystyle{ \lambda }[/math] being viewed through the eye peice](https://oww-files-thumb.sfo3.cdn.digitaloceanspaces.com/1/19/Physics_307L_Balmer_mic.JPG/120px-Physics_307L_Balmer_mic.JPG) Adjustment dial used to change the value of [math]\displaystyle{ \lambda }[/math] being viewed through the eye peice
Adjustment dial used to change the value of [math]\displaystyle{ \lambda }[/math] being viewed through the eye peice -
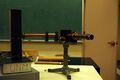 Full set up. Constant deviation spectrometer and light box for source.

![Adjustment dial used to change the value of [math]\displaystyle{ \lambda }[/math] being viewed through the eye peice](/wiki/File:Physics_307L_Balmer_mic.JPG)

SJK 00:43, 26 October 2007 (CDT)
These are great notes! These are the kind of notes I'd like to see on your [Physics307L F08:People/Rivera/Notebook/071008 "primary notebook" wiki page.]
The first thing to set up was making sure we had the correct source in the light box. The manual calls for a mercury tube which we placed in the box. We then turned the box on an waited about 5 minute for the tube to warm up. Next through manipulation of the crystal and the adjustment dial, while looking through the eyepiece we began locating the mercury lines and matching them to the values given in the manual sec. 4.3. After this we covered the prism and took some readings to get a sense of any deviations in the instrumentation. These numbers can be found here in my lab book. We did make sure to take all of our measurements when turning the screw in the counterclockwise direction, as the manual says to take all measurements in one direction because of limitations with the dial. After this we were ready to start the experiment.
The Hydrogen Spectrum
We now located the hydrogen tube and set it up allowing time for the tube to warm up before taking data. We took ten data points for the hydrogen tube. Next we located the deuterium tube and after allowing it to warm up we once again took 10 measurements. These can be found here in my lab book.. We looked at four of the hydrogen lines they were:
[math]\displaystyle{ Red=>H-\alpha }[/math]
[math]\displaystyle{ Blue-Green=>H-\beta }[/math]
[math]\displaystyle{ Violet=>H-\gamma }[/math]
[math]\displaystyle{ Violet=>H-\delta }[/math]
We looked at the same lines for deuterium, this data can be found here in my lab book also..
Given the differences between Hydrogen and Deuterium I would expect to see a difference in the Rydberg constant given a precise enough device, but after taking data and looking at the two yellow lines for sodium, I don't feel that our numbers between the two will differ enough to make a distinction between the two.
Sodium Lines [math]\displaystyle{ \lambda=589.0 }[/math] & [math]\displaystyle{ \lambda=589.6 }[/math]
SJK 00:44, 26 October 2007 (CDT)
remember to label "nm" on the wavelengths
Looking at the two lines of Na through the eye piece we could not differ between the two lines [math]\displaystyle{ \lambda=589.0 }[/math] & [math]\displaystyle{ \lambda=589.6 }[/math]. Although we felt we could see two lines we couldn't get a difference between the two on the dial. We also felt that because of optical issues that may be present the two lines were pretty much indistinguishable and that the two lines we thought we were seeing was just an illusion because of their proximity to each other.
Calculations
SJK 01:04, 26 October 2007 (CDT)
Excellent data analysis! Your spreadsheet was very easy to read, and your calculations look terrific. I uploaded a tweaked version, showing how to fit the data to a line as an alternate method.
The excel sheet with our numbers and calculations can be fount at File:BalmerSeries.xls.
We used the formula [math]\displaystyle{ R=\frac{1}{\frac{\lambda}{4}-\frac{\lambda}{n^2}} }[/math] and are reporting to determine the value of R for both Hydrogen and Deuterium.
Hydrogen
SJK 00:49, 26 October 2007 (CDT)
Hey! You need to put units on all of these numbers!!!
For Hydrogen we found:
[math]\displaystyle{ R=1.093\times10^7(\frac{+}{-}4.820\times10^4) }[/math] compared to the accepted value of [math]\displaystyle{ 1.097\times10^7 }[/math] we had a Experimental difference of [math]\displaystyle{ 3.52\times10^4 }[/math] which is within our standard deviation in R giving us a relative error of 0.32%
Deuterium
For Hydrogen we found:
SJK 00:55, 26 October 2007 (CDT)
It's still a little tough to read...I would prefer using the same exponent for the error, so like
R=(1.095 +/- 0.004) * 10^7 m^-1
, also, of course you need units and you don't need that many digits on your uncertainty. One digit is fine, two at the most.
Also, it would be good to explain how to calculate the Rydberg constant for the two different masses of nuclei and to state the values so you can tell the difference: (i.e, R_H=1.09677..., R_D=1.09647... m^-1)
Finally, you would want to compare the Deuterium value to the accepted value for Deuterium, not Hydrogen, of course.
[math]\displaystyle{ R=1.095\times10^7(\frac{+}{-}3.689\times10^4) }[/math] compared to the accepted value of hydrogen [math]\displaystyle{ 1.097\times10^7 }[/math] we had a Experimental difference of [math]\displaystyle{ 2.33\times10^4 }[/math] which is within our standard deviation in R giving us a relative error of 0.21%
Given a more precise instrument I would expect to have more of a deviation between hydrogen and deuterium, but given the restraints of the apparatus (shown by observing the yellow lines in sodium), it is not surprising that the two are overlapping in their spectral line distributions.
Lessons Learned
This was a pretty easy lab and was nice after the last few we did. I really enjoyed playing with the data and setting up the numbers. It is sometimes surprising that you could get such a basic relationship with such a simple experiment.SJK 01:04, 26 October 2007 (CDT)
and it seems pretty impressive to get 0.3% relative error as well!
