Physics307L F08:People/Dougherty/Notebook/071119
Cary M. Dougherty 20:05, 6 December 2007 (CST)
Excitation of Neon
Linh and I decided to do the excitation of Neon levels. However I was sick the first day of data taking. Erron and Linh worked on it the first day, then all 3 of us were taking data the second day, which turned out to be better data thanks to Professor Koch.
For full lab details see Lab manual pg 45
Setup/Procedure


"The essence of this experiment is the demonstration of energy quantization of atoms, Ne in this case. This is achieved via inelastic e− scattering off Ne atoms. As such it is closely related to the original Franck-Hertz experiment (1914), which showed that an electron must have a certain minimum energy to make an inelastic collision with an atom. We now interpret that minimum energy as the energy of an excited state of the atom. It is strongly advised to read up on the Franck-Hertz experiment.
From a collision standpoint, free electrons colliding with orbiting electrons need to have at least the minimum energy required to excite the bound electrons to higher quantum levels. This experiment involves collecting these electrons after their atomic collisions, and determining the separate excitation energy levels that are available. The theory is quite simple. If an electron collides with a bound electron, and has suffcient energy to “move” the bound electron up into new orbits (or even ionize the atom), then the energy absorbed by the atom is lost to the free electron. This is an inelastic collision, and the free electron will slow down appreciably. In particular, it can now easily be captured by an anode positioned near the beam. As a function of the electron accelerating potential, [math]\displaystyle{ V_A }[/math], the number of electrons captured will increase rapidly near the energy levels of the atomic gas in the tube. These peaks in current will signal the energy levels of the atom."(from Physics 307 Lab Manual)
Following the details of the circuit from Fig. 2, we were able to set up the entire apparatus and set the heater to a small voltage, never exceeding 2.5 V. After that we kept the accelerating voltage at zero so we could also zero out the alarm meter. After this we could make a broad sweep and find drastic peaks and valleys on the meter. After finding them we made very detailed sweeps of those certain areas to get detailed data to plot. Then after a while as you keep increasing the voltage, we found the current grows unbounded. The point where it does that we concluded is the ionization of the Ne gas.
Equipment
- Fluke 111 true rms multimeter
- Hertz Critical Potentials Tube filled with neon
- Picoamplifier and alarmed meter
- 2 HP power supplies
Data
(battery - to - and + to +)
Measuring peaks
Vf=2.5V
| VA (volts) | Ic pA |
|---|---|
| 14.00 | -6 |
| 14.25 | -6 |
| 14.50 | -6 |
| 14.75 | -6 |
| 15.00 | -6 |
| 15.25 | -6 |
| 15.50 | -7 |
| 15.75 | -7 |
| 16.00 | -6 |
| 16.25 | -5 |
| VA (Volts) | Ic pA |
|---|---|
| 20.00 | -3 |
| 20.25 | -2 |
| 20.50 | -2 |
| 20.75 | -2 |
| 21.00 | -2 |
| 21.25 | 0 |
| 21.50 | 0 |
| 21.75 | 1 |
| 22.00 | 2 |
| 22.25 | 3 |
| 22.50 | 4 |
| 22.75 | 5 |
| 23.00 | 6 |
[Thanks to Dr. Koch shoving in the tube, we are getting some better numbers]
| VA (Volts) | Ic pA |
|---|---|
| 15.00 | -1.516 |
| 15.25 | -1.547 |
| 15.50 | -1.579 |
| 15.75 | -1.610 |
| 16.00 | -1.640 |
| 16.25 | -1.659 X |
| 16.50 | -1.620 |
| 16.75 | -1.651 X |
| 17.00 | -1.569 |
| 17.25 | -1.235 |
| 17.50 | -1.138 |
| 17.75 | -1.186 |
| 18.00 | -1.057 |
- day 2
(battery + to + and - to -) Vf=2.000V
| Va (V) | Current (mA) |
|---|---|
| 17.00 | -.063 |
| 17.25 | -.086 |
| 17.50 | -.140 |
| 17.75 | -.103 |
| 18.00 | -.093 |
| 18.25 | -.119 X |
| 18.50 | -.107 |
| 18.75 | -.102 |
| 19.00 | -.092 |
| 19.25 | -.086 |
| 20.00 | -.093 |
| 20.25 | -.109 |
| 20.50 | -.125 X |
| 20.75 | -.118 |
| 21.00 | -.106 |
| 21.25 | -.118 |
| 21.50 | -.118 |
| 21.75 | -.120 |
| 22.00 | -.121 |
- continues to grow unbounded after this point
Battery flip (+to- and -to+) Vf 2.00A
| Va (V) | Current (mA) |
|---|---|
| 17.50 | -.015 |
| 17.75 | ~-.0003 |
| 18.00 | .028 |
| 18.25 | .040 |
| 18.50 | .044 |
| 18.60 | .051 |
| 18.70 | .062 |
| 18.80 | .069 |
| 18.90 | .075 |
| 19.00 | .078 |
| 19.10 | .80 |
| 19.20 | .082 |
| 19.30 | .084 |
| 19.40 | .086 |
| 19.50 | .088 |
| 19.60 | .090 |
| 19.70 | .093 |
| 19.80 | .096 |
| 19.90 | .098 |
| 20.00 | .100 |
| 20.10 | .102 |
| 21.50 | .135 |
| 21.60 | .139 |
| 21.70 | .142 |
| 21.80 | .144 |
| 21.90 | .148 |
| 22.00 | .151 |
| 22.10 | .154 |
| 22.20 | .158 |
| 22.30 | .163 |
| 22.40 | .167 |
| 22.50 | .173 |
| 22.60 | .181 |
| 22.70 | .188 |
| 22.80 | .196 |
| 22.90 | .205 |
| 23.00 | .213 |
- Battery (+ to - and - to +)
Vf=2.476V
| Va (V) | Current (mA) |
|---|---|
| 17.00 | -.071 |
| 17.25 | -.001 |
| 17.30 | .026 |
| 17.40 | .081 |
| 17.50 | .142 |
| 17.60 | .180 |
| 17.70 | .201 |
| 17.75 | .206 |
| 17.80 | .210 |
| 17.90 | .213 |
| 18.00 | .221 |
| 18.10 | .255 |
| 18.20 | .304 |
| 18.30 | .344 |
| 18.40 | .374 |
| 18.50 | .389 |
| 18.60 | .397 |
| 18.70 | .406 |
| 18.80 | .416 |
| 18.90 | .425 |
| 19.00 | .437 |
| 19.10 | .449 |
| 19.20 | .462 |
| 19.30 | .473 |
| 19.40 | .489 |
| 19.50 | .497 |
| 19.60 | .506 |
| 19.70 | .514 |
| 19.80 | .524 |
| 19.90 | .545 |
| 20.00 | .555 |
Data Analysis
The first day of taking data Linh and Erron had a lot of trouble it sounded like. I wasn't able to be there, but from what it looks like, nothing was coming out correct. Then Professor Koch pushed in the neon tube farther and the second day when I was there, we were getting much better data to record. So i will only be using the last 4 data sets.
By graphing the [math]\displaystyle{ I_c }[/math] (Pa) vs. the [math]\displaystyle{ V_a }[/math] (V) I got these sets of graphs:(Fig. 1 - 4)


-
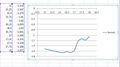 Fig. 1 1st data set with original values
 -
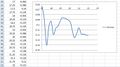 Fig. 2 2nd data set with original values
 -
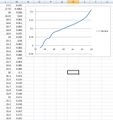 Fig. 3 3rd data set with original values
 -
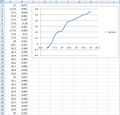 Fig. 4 4th data set with original values


Looking at our graphs and comparing them to the sample graphs in the lab manual (See Fig. 5 and 6), I concluded that the polarity of the battery might have been mixed up. Since the second sample graph has a small amount of positive values then switches abruptly to negative, i assumed that was what happened for our last two graphs. Also our first two graphs are purely negative and the sample graph in the lab manual was strictly positive. Considering these two points I assumed the polarities were opposite so I switched the negative and positive values and came up with another set of graphs that looked much better to the sample graphs. (see Fig. 7 - 10)
-
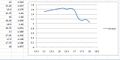 Fig. 7 1st data set with positive values
 -
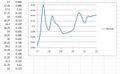 Fig. 8 2nd data set with positive values
 -
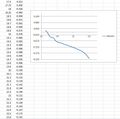 Fig. 9 3rd data set with positive and negative values switched
 -
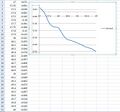 Fig. 10 4th data set with positive and negative values switched


As Linh pointed out, we found peaks at 16.25, 16.75, 18.25, and 20.50. Which we found to close to the peaks found in the lab manual. Considering this a good sign, we felt the experiment went decently well.
And after the point of 21.25 V the current grew unbounded. We felt it was the ionization level of the Ne gas.
Conclusion
As i said above, the experiment went rather well. I wanna thank Linh and Erron for doing a lot of the hard work before i could make it in to help.
Also looking at our graphs, I think they are at least relatively like the sample graphs from the lab manual. Of course I didn't expect them to be exactly the same.
Error
The original peaks we found are 16.25, 16.75, 18.25, and 20.50.
Since these are close to some peaks found in the manual I would like to show the error we have from the lab manual.
[math]\displaystyle{ %error= \frac{|Actual-Experimental|}{|Actual|}x100 }[/math]
[math]\displaystyle{ %error= \frac{|16.7-16.75|}{|16.7|}x100 }[/math]
[math]\displaystyle{ %error=.3 }[/math]
[math]\displaystyle{ %error= \frac{|19.75-18.25|}{|19.75|}x100 }[/math]
[math]\displaystyle{ %error=7.59 }[/math]
[math]\displaystyle{ %error= \frac{|20.1-20.5|}{|20.1|}x100 }[/math]
[math]\displaystyle{ %error=1.9 }[/math]
now taking the average of our error, Average Error= 3.26%
Avery small error considering the fragile state of the experiment. Any movement or noise or talking disrupted the entire apparatus and would skew our measurements. But we were able to work through them and get some pretty decent data.
