Physics307L F08:People/Dougherty/Notebook/071001
SJK 00:50, 12 October 2007 (CDT)

Overall, the parts of your notebook that I see are well done. I really like the graphs and the calculation of your final answer with uncertainty from random error. However, there are many things missing, which are critical for a good lab notebook. These include: (1) model # and description of instrumentation; (2) much more description of measurement methods. A good strategy would be to cite the lab manual, and then record all the little details that aren't in the manueal (i.e, "we're using my cell phone for a stop watch, it's a Nokia.") the notes in your notebook should be taken as you go along, and don't have to be written well or anything...the only goal is to record as much information as possible so that later on people (including you) can know what you did.
Experiment 1 Results
UV plot
http://openwetware.org/images/2/26/Untitled.JPG
Blue-Violet plot
http://openwetware.org/images/f/fb/Blue_violet.JPG
Green plot
http://openwetware.org/images/8/80/Green.JPG
Yellow 1 plot
http://openwetware.org/images/6/6a/Yellow1.JPG
Yellow 2 plot
http://openwetware.org/images/e/e8/Yellow_2.JPG
Experiment 2 Results
SJK 00:40, 12 October 2007 (CDT)
Good job citing where you obtained this graph!
http://dev.physicslab.org/Document.aspx?doctype=3&filename=AtomicNuclear_PhotoelectricEffect.xml
 Photoelectric Effect/Stopping Potential Relations
Graphs
SJK 00:42, 12 October 2007 (CDT)
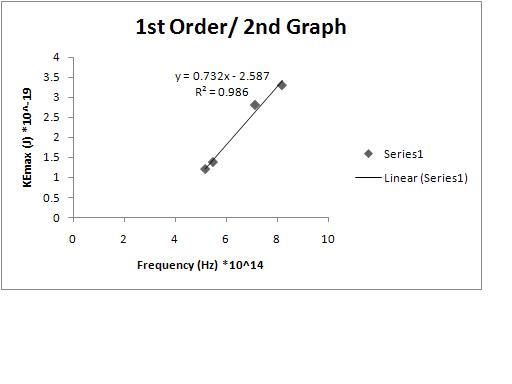
The data in these sections look really good! Although they are not labeled particularly well so that someone would know how the data were obtained. For example, what is 1st order / 2nd order? Even you in a few months would probably be confused!
http://openwetware.org/images/4/4c/1st_1st.JPG
h = 6.92*10^-34 J [math]\displaystyle{ W_0 }[/math] = 2.373*10^-19 J
http://openwetware.org/images/9/99/1st_2nd.JPG
h = 6.99*10^-34 J [math]\displaystyle{ W_0 }[/math] = 2.416*10^-19 J
http://openwetware.org/images/5/55/2nd_1st.JPG
h = 7.32*10^-34 [math]\displaystyle{ W_0 }[/math] = 2.587*10^-19 J
http://openwetware.org/images/e/ed/2nd_2nd.JPG
h = 7.29*10^-34 J [math]\displaystyle{ W_0 }[/math] = 2.569*10^-19 J
Mean Value
h = 7.13*10^-34 [math]\displaystyle{ W_0 }[/math] = 2.48625*10^-19 J
Standard Deviation
- [math]\displaystyle{ s = \sqrt{\frac{1}{N-1} \sum_{i=1}^N (x_i - \overline{x})^2} }[/math]
[math]\displaystyle{ s }[/math] = 2.04450484*10^-35
Standard Error of the Mean
SJK 00:45, 12 October 2007 (CDT)
As far as I see, you calculated the standard error of the mean correctly...good work!
- [math]\displaystyle{ s = \sqrt{\frac{1}{N-1} \sum_{i=1}^N (x_i - \overline{x})^2} }[/math]
- [math]\displaystyle{ SE = \frac{s}{\sqrt{N}} }[/math]
SE = 1.02225242*10^-35
"Planck's Constant"
7.13*10^-34 +/- 1.02225242*10^-35
Error
SJK 00:45, 12 October 2007 (CDT)
Great comparison with the accepted value...you would want to include this very relevant info in your summary!
[math]\displaystyle{ %error= \frac{|Actual-Experimental|}{|Actual|}x100 }[/math]
%error = 7.54%
reasons for errors
SJK 00:32, 12 October 2007 (CDT)
I would say possible errors, and then add some explanation as to how this may affect the data, and what you think is most likely. It appears your h is too high, which means your slope is too high...how would bad filters or extraneous light produce this effect?
light filtering in from other sources
bad filters on the apparatus
bad volt meter
