Physics307L F07:People/Le/FormalFin
Discovering the Fundamental Charge and Investigating Quantized Amounts of Charge Using the Milikan Oil Drop Experiment
Linh Le, Cary Dougherty
Physics and Astronomy Department, Junior Lab 307, University of New Mexico, Albuquerque, New Mexico
Email: linhle@unm.edu
Abstract
To explain the connection between electricity and matter, scientists in the late 19th century argued there had to be a fundamental unit of electricity. To find this fundamental unit, we repeated Robert Millikan's famous Oil-Drop Experiment. The Millikan Oil drop experiment is the product of other attempts. The Millikan experiment was best at determining the charge of an electron, and showing the quantized nature of these charges.
To repeat Millikan we sprayed oil droplets into a capacitor and then ionized the droplets to give them excess electrons. We then exposed these droplets to a constant electric field. Measuring the fall time of the droplets without the field, then measuring the rise time with the field on, we were able to compare the force of gravity pulling down on the droplets to the force of the electric field causing them to rise. In doing so, we were able to get a fundamental charge of [math]\displaystyle{ (1.5193+/-0.07)x 10^{-19} coulombs }[/math], very close to the accepted value of [math]\displaystyle{ 1.60217733x10^{-19} }[/math] Coulombs.
Introduction
There have been many attempts by many different people to measure the charge of an electron. The first notable was Townsend. Townsend was the first to show that some of the gases created by electrolyzing sulphuric acid came out charged. He then bubbled these gases through water, then through sulphuric acid to dry them. He assumed that the charged ions collected water molecules around them. He measured the rate of fall of the water droplets to find their mass and used Stoke's Law to find the volume. Bubbling the gas through the acid dried up the water. The drying of the water causes the excess charge to collect in the air molecules, which were then passed into drying tubes, then weighed. He divided the weight of the gas cloud by the average weight of the water to find the amount of excess charge, then divided that by the volume of the droplets to find the amount of charge per ion.(3)
The next notable experiment was done by J.J Thompson, which closely resembled Townsend's work. Instead of measuring a gas, Thompson ionized particles using an X-ray tube. He then took this ionized gas and ran it through a small voltage to find the charge per cubic centimeter of the gas. Thompson then allowed the gas to enter a pistoned chamber, which he then expanded the gas to allow it to cool and collect water droplets. Mimicking Townsend, Thompson calculated fall times to get the mass and size of the droplets. (3)
Both Townsend and Thompson had some fundamental flaws in their experiments, namely, not accounting for evaporation in the droplets as they fell, and assuming the number of droplets was equal to the amount of charged ions. H.A Wilson had a solution for this problem. Wilson took Thompson's experiment, but placed 2 charged plates in the "falling chamber". By comparing the velocities with the field on and with the field off, in a short distance, he eliminated a great deal of uncertainty in the amount of charge and the evaporation.(3)
With these experiments under our belt, we now follow in Millikan's footsteps in recreating his famous Oil Drop experiment. Since evaporation was such a topic of uncertainty, we, as Millikan proposed, use an electric field strong enough to not just slow the fall of these particles, but to suspend them or cause them to rise. The ionized droplets, in this case oil since it does not evaporate as easily as water, are observed through a microscope. This method is a huge improvement since we can observe individual droplets, rather than a statistical overview of many.
Methods and Materials
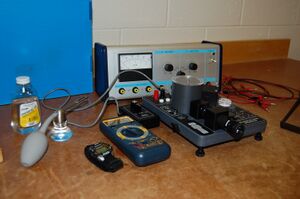
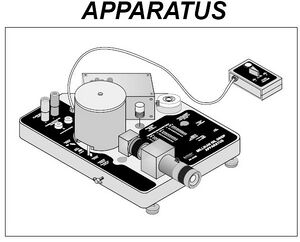
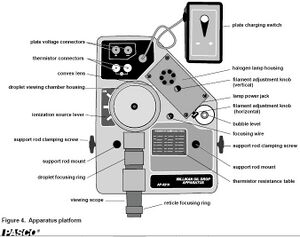
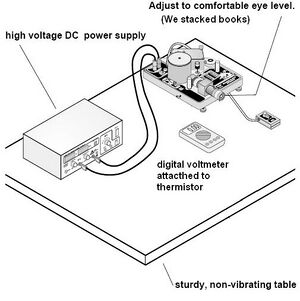
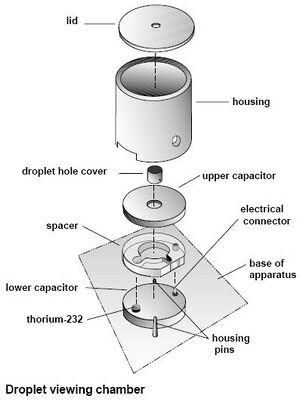
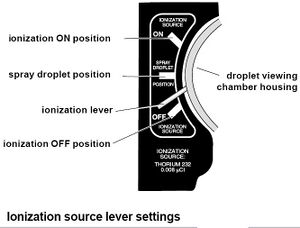
- "Millikan Oil Drop Apparatus" by PASCO Scientific Model AP-8210.Manual
- Tel-Atomic 50V & 500V supply
- Fluke 111 True RMS Multimeter
- Squibb's Mineral Oil
- Smiec 0-25mm 0.01mm Micrometer
Procedure
Setup
The apparatus did not require any extra assembly to operate. We connected a power supply to the capacitor leads, a digital multimeter to the thermistor, plugged the light source into a wall socket, and filled the oil spray bottle with the mineral oil. After raising the apparatus to a comfortable eye level (books were used) we adjust it to be level using the built in leveling gauge and the adjustable feet. (See Fig 4)
To calibrate the apparatus, we opened up the cylindrical housing for the capacitor and took out the droplet hole cover, the upper capacitor plate and the spacer. After measuring the spacer with a micrometer, we replaced it and the upper plate. Unscrewing the focusing wire (located to the right of the capacitor) we placed the wire through the hole in the top of the upper plate and replaced everything else but the droplet hole cover. With the room dark and the lamp plugged in, we looked through the microscope and put the needle in focus, adjusting the amount of light entering the capacitor as appropriate. With the needle and grid inside the eyepiece all focused, we opened the housing, removed the needle, and replaced the droplet hole cover. (See Fig 5)
Experiment
After the apparatus has been setup, we begin by introducing the oil to the capacitor. We placed the special nozzle of the oil sprayer into a small hole in the top of the lid. To the right of the housing is a lever,(see fig 6) the lever must be set to the middle position "Spray Droplet" to allow the oil to enter the capacitor. While someone is watching the microscope, a quick spray followed by smaller, slower sprays are applied (it is helpful to remove the nozzle from the hole before releasing the sprayer to prevent the air from being sucked back out of the capacitor). The oil droplets will appear to be a "shower of sparkles" as the fall into view. Continue spraying until you see a fair amount of particles in view.
After the oil is inside the chamber, we remove the nozzle and set the lever down to the "off" position. We then switch the lever to the "on" position for 2 or 3 seconds to allow the ionizer to ionize the oil particles, then switch it back to the "off" position. To check that the oil droplets are properly ionized, we looked through the microscope and switched the polarity of the plates (see fig 3) to see if the oil droplets react differently. Ideally, they should rise when the upper plate is polarized positive (+) and fall faster when the it is polarized negative (-).
After the droplets have been properly ionized, we sought out to isolate a single droplet of which to study. The droplets can be separated by moving them by switching the polarities in the plates. Using the grid within the eyepiece of the microscope, we looked for a droplet that fell .5mm (one large unit in the grid, or 5 smaller units) in 15 seconds and rose the same amount in 3 seconds. Once a particle of that nature was found, we recorded its fall time and rise times 10 times each(when possible). After taking sufficient data, we turned the ionizer back to the "on" position for 1 or 2 seconds and repeated the experiment with the same droplet (when possible).
Data Analysis
Using the fall and rise times, we were able to determine a few things about the droplets and the charge.
To find the fall and rise times, we said that [math]\displaystyle{ V=\frac{d}{t} }[/math]. We use this simple formula since the droplets reach terminal velocity very quickly and travel at a constant rate after that.
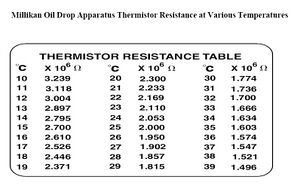
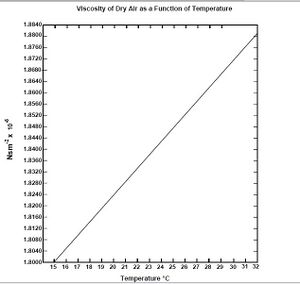
To find the charge stored in the electron:
[math]\displaystyle{ q=\frac{mg(v_f+v_r)}{Ev_f} }[/math]
[math]\displaystyle{ m=\frac{4}{3}\pi a^3 \rho }[/math]
[math]\displaystyle{ a=\sqrt{(\frac{b}{2p})^2 +\frac{9 \eta v_f}{2g\rho}}-\frac{b}{2p} }[/math]
[math]\displaystyle{ q = {\frac{4}{3}}\pi \rho g[\sqrt{(\frac{b}{2p})^2 +\frac{9 \eta v_f}{2g\rho}}-\frac{b}{2p}]^3\frac{v_f + v_r}{Ev_f} }[/math]
q- the charge of the electron
p-barometric pressure-[math]\displaystyle{ 8.33^4Pa }[/math] (Note: This value was taken from the internet. The pressure is measured with respect to my current elevation above sea level. Any small variations due to specific locations or weather are assumed negligible)
d-distance between capacitor plates 7.60mm
g- acceleration due to gravity- [math]\displaystyle{ 9.8 \frac{m}{s^2} }[/math]
b- constant [math]\displaystyle{ 8.20E(-3)Pa * m }[/math]
a- radius in drop measured in meters
[math]\displaystyle{ \rho }[/math]-density of the oil which is [math]\displaystyle{ 886 \frac{kg}{m^3} }[/math]
[math]\displaystyle{ \eta }[/math]- viscosity of air (found by the comparing temp inside the capacitor see figs 7,8. This was an "eyeball" read, but the variations between 1 degree are very nominal)
V- potential difference across the plates in Volts
[math]\displaystyle{ v_r }[/math]- rise velocity (dividing .5mm by rise time)
[math]\displaystyle{ v_f }[/math]- falling velocity (dividing .5mm by rise time)
E electric field (found by [math]\displaystyle{ \frac{V}{d}) }[/math]
After calculating the charge of a particle, we plot it against the rise time. Taking the charges that appear close together, we then plot those averages and take a linear regression to find the value of e.
(All data calculated with MATLAB and plots created with Excel)
Results
Raw Data
Due to the length of the raw data, it will be included at the end of the paper in an appendix
Calculated Data
| Trial | E field (V/m) | Viscoscity of Air e-5(Ns/m^2) | Vfall Avg e-5(m/s) | Vrise Avg e-4(m/s) | Q e-19 (couloumbs) |
|---|---|---|---|---|---|
| 1A | 65921.05 | 1.848 | 3.408 | 1.205 | 3.60 |
| 1B | 66039.47 | 1.848 | 3.608 | 2.118 | 5.98 |
| 2 | 65789.47 | 1.852 | 3.225 | 1.683 | 4.54 |
| 3 | 65921.05 | 1.844 | 2.855 | 1.106 | 2.89 |
| 4 | 65973.68 | 1.852 | 3.243 | 2.304 | 5.95 |
| 5 | 65789.47 | 1.852 | 1.598 | .8465 | 1.44 |
| 5A | 66276.31 | 1.848 | 1.637 | 1.755 | 2.84 |
| 6 | 65815.79 | 1.848 | 2.199 | .6404 | 1.52 |
| 6B | 65907.89 | 1.852 | 2.098 | .6225 | 1.42 |
| 7 | 65776.21 | 1.852 | 3.074 | .3396 | 1.42 |
| 7B | 65947.36 | 1.850 | 2.877 | 2.688 | 6.24 |
| 8 | 65815.78 | 1.850 | 2.355 | .7349 | 1.79 |
| 8B | 65907.89 | 1.852 | 2.230 | .7111 | 1.66 |
There is a noticeable trend in rise times vs the number we got for Q. Plotting them below, we can see that some values tend to group together. This leads me to believe the quantized nature of the charges.
http://openwetware.org/images/0/02/Qvsrise2.JPG
Taking notice of this, I averaged the values that were close, and set the lowest value as 1Q, 2nd highest as 2Q, etc. Using a least squares fit, I found the value for the fundamental charge to be [math]\displaystyle{ (1.5193+/-0.07)x 10^{-19} coulombs }[/math] (the "linest" command gives me the deviation and slope of the line).
http://openwetware.org/images/b/be/Qvalue1.JPG
Conclusion
The experiment went very well, with no huge sources of conflict. Since the actual value of the fundamental charge is known, our value can be compared to it for a qualitative accuracy of the experiment.
[math]\displaystyle{ %error= \frac{|Actual-Experimental|}{|Actual|}x100 }[/math]
[math]\displaystyle{ %error= \frac{|1.60217646 x 10^{-19}-1.5193 x 10^{-19}|}{|1.60217646 x 10^{-19}|}x100 }[/math]
[math]\displaystyle{ %error=5.17 }[/math]
The largest contributer to errors was the small size of the droplets. The droplets experienced a high amount of Brownian motion. The droplets would move about the viewing area, leaving view completely before enough measurements could be made. Also, the droplets were no bigger than the partition lines in the grid, so it is easy to lose them behind a line and miss stopping the clock.
The best fix would be to hook up a camera to the microscope. It would allow us to record the movement of the droplets, allowing us a very detailed an accurate way to measure rise and fall times and measure more than one droplet at a time.
Acknowledgments
I would like to thank the following people:
- My lab partner Cary Dougherty, for helping take measurements
- The lab professor, Dr. Koch, for getting this all working
- Kyle Martin and Jesse Smith, from whom I borrowed my charge calculation method from
- Millikan, for discovering this in the first place
References
Determination of the Charge on an Electron 2
Appendix 1
Spacing of plates: 8.10mm
Density of Squibb's Mineral Oil: 886kg/m^3
Atmospheric Pressure in Abq (as looked up on the internet): 8.33X10^4 Pa
Set 1
Voltage: 501V Resistance: 1.9982 M(ohms) Distance: .5mm
| Fall Time (s) | Rise Time (s) |
|---|---|
| 18.38 | 3.31 |
| 14.38 | 3.15 |
| 14.11 | 5.14 |
| 13.7 | 5.7 |
| 13.8 | 5.19 |
| 14.72 | 5.52 |
| 14.5 | 5.23 |
| 13.13 | 5.27 |
| 15.37 | 5.37 |
| Avg Fall Time | Avg Rise Time |
| 14.67s | 4.877s |
In this set, we were able to change the charge on the droplet and remeasure
Voltage=501.9V Resistance=1.976M(ohms)
| Fall Time (s) | Rise Time (s) |
|---|---|
| 13.28 | |
| 13.86 | 2.19 |
| 14.58 | 2.21 |
| 13.09 | 2.70 |
| 14.38 | 2.46 |
| 13.94 | 2.24 |
| Avg Fall Time(s) | Avg Rise Time(s) |
| 13.855 | 2.36 |
Set 2
Voltage: 500V Resistance: 1.923M(ohms)
| Fall Time(s) | Rise Time(s) |
|---|---|
| 15.97 | 2.99 |
| 14.50 | 3.13 |
| 13.80 | 2.95 |
| 15.50 | 2.69 |
| 15.17 | 2.75 |
| 15.36 | 3.36 |
| Avg Fall Time(s) | Avg Rise Time(s) |
| 15.05 | 2.97 |
We changed the charge of the oil droplet in this set as well, but the droplet moved so fast, that it was very hard to sync Cary's observations and oral commands with my data collecting. As that is the case, we only took 2 data points.
| Fall Time (s) | Rise Time(s) |
|---|---|
| 9.70 | .72 |
| 10.32 | .73 |
Set 3
Starting Voltage: 501.0 V Resistance: 2.07 M(ohms) Ending Voltage:501.8 V 2.041M(Ohms)
| FALL TIME (s) | RISE TIME (s) |
|---|---|
| 14.87 | 4.81 |
| 17.53 | 4.87 |
| 17.17 | 4.85 |
| 18.67 | 4.57 |
| 17.89 | 4.53 |
| 17.77 | 4.37 |
| 15.93 | 4.56 |
| 16.49 | 4.90 |
| 18.97 | 4.61 |
| 18.41 | 5.11 |
| 19.24 | 2.50 |
| Avg Fall Time(s) | Avg Rise Time(s) |
| 17.54 | 4.52 |
Set 4
Starting Voltage:501.4 V Resistance:1.945 M(Ohms)
| Fall Time (s) | Rise Time (s) |
|---|---|
| 16.13 | 2.23 |
| 14.29 | 2.14 |
| 14.85 | 2.47 |
| 15.96 | 1.93 |
| 16.49 | 1.99 |
| 14.79 | 2.25 |
| Avg Fall Time(s) | Avg Rise Time(s) |
| 15.42 | 2.17 |
trial 1a
resist= 2.086 ohms
temp 26 c
viscosity=1.8520
voltage= 500V
| Times | Fall Time | Rise Time |
|---|---|---|
| 0 | ||
| 31.609 | 31.609 | |
| 43.281 | ||
| 49.297 | 6.016 | |
| 59.016 | ||
| 88.293 | 29.227 | |
| 1:32.687 | ||
| 1:38.500 | 5.813 | |
| 1:46.000 | ||
| 2:17.297 | 31.297 | |
| 2:20.953 | ||
| 2:26.328 | 5.375 | |
| 2:39.141 | ||
| 3:14.875 | 35.734 | |
| 3:19.875 | ||
| 3:25.891 | 6.016 | |
| 3:34.844 | ||
| 4:03.469 | 28.625 | |
| 4:09.156 | ||
| 4:15.469 | 6.313 | |
| Avg Fall | Avg Rise | |
| 31.2984 | 5.9066 |
a2
resistance 2.023
temp 25c
viscosity 1.8480
voltage 503.7
| Time | Fall Time | Rise Time |
|---|---|---|
| 0 | ||
| 27.875 | 27.875 | |
| 31.797 | ||
| 34.594 | 2.797 | |
| 49.813 | ||
| 79.282 | 29.469 | |
| 1:22.000 | ||
| 1:25.141 | 3.141 | |
| 1:37.032 | ||
| 2:11.485 | 34.453 | |
| 2:16.438 | ||
| 2:19.047 | 2.609 | |
| 2:32.141 | ||
| 3:02.500 | 30.359 | |
| may have | lost droplet | |
| 3:08.469 | ||
| 3:10.219 | 1.75 | |
| Avg Fall | Avg Rise | |
| 30.539 | 2.849 |
trial 2
resist 1.990
temp 25c
viscosity 1.8480
voltage 500.2v
| Time | Fall Time | Rise Time |
|---|---|---|
| 0 | ||
| 23.953 | 23.953 | |
| 31.422 | ||
| 39.750 | 8.328 | |
| 47.906 | ||
| 71.390 | 23.484 | |
| 1:17.406 | ||
| 1:25.187 | 7.781 | |
| 1:27.765 | ||
| 1:49.094 | 21.329 | |
| 1:55.625 | ||
| 2:03.047 | 7.422 | |
| 2:11.406 | ||
| 2:31.875 | 19.469 | |
| 2:38.140 | ||
| 2:45.609 | 7.469 | |
| 2:48.750 | ||
| 3:12.172 | 23.422 | |
| 3:17.625 | ||
| 3:25.953 | 8.328 | |
| 3:32.781 | ||
| 3:57.547 | 24.766 | |
| 4:05.890 | ||
| 4:13.406 | 7.516 | |
| Avg Fall | Avg Rise | |
| 22.737 | 7.807 |
2b
resist 1.951
temp 26c
viscosity 1.8520
voltage 5.009
| Time | Fall Time | Rise Time |
|---|---|---|
| 0 | ||
| 25.344 | 25.344 | |
| 31.375 | ||
| 39.750 | 8.375 | |
| 55.625 | ||
| 77.484 | 21.859 | |
| 1:21.391 | ||
| 1:29.625 | 8.234 | |
| 1:35.469 | ||
| 1:58.094 | 22.625 | |
| 2:04.641 | ||
| 2:12.250 | 7.609 | |
| 2:17.078 | ||
| 2:42.563 | 25.485 | |
| 2:46.859 | ||
| 2:54.766 | 7.907 | |
| Avg Fall | Avg Rise | |
| 23.828 | 8.031 |
trial 3
resistance 1.978
temp 26c
viscosity 1.8520
voltage 499.9
| Time | Fall Time | Rise Time |
|---|---|---|
| 0 | ||
| 15.593 | 15.593 | |
| 24.250 | ||
| 39.031 | 14.781 | |
| 46.906 | ||
| 64.64 | 17.734 | |
| 1:13.406 | ||
| 1:27.000 | 13.594 | |
| 1:34.375 | ||
| 1:50.140 | 15.765 | |
| 1:59.203 | ||
| 2:13.375 | 14.172 | |
| 2:20.187 | ||
| 2:37.312 | 17.125 | |
| 2:44.187 | ||
| 2:57.953 | 13.766 | |
| 3:04.250 | ||
| 3:19.359 | 15.109 | |
| 3:25.531 | ||
| 3:39.828 | 14.297 | |
| Avg Fall | Avg Rise | |
| 16.265 | 14.722 |
3b
resistance 1.975
temp 25.5
viscosity 1.850
voltage 501.2
| Time | Fall time | Rise time |
|---|---|---|
| 0 | ||
| 17.375 | 17.375 | |
| 26.968 | ||
| 28.828 | 1.86 |
4
resistance 1.974
temp 25.5
viscosity 1.850
voltage500.2
| Time | Fall Time | Rise Time |
|---|---|---|
| 0 | ||
| 21.344 | 21.344 | |
| 26.953 | ||
| 34.141 | 7.188 | |
| 38.828 | ||
| 58.250 | 19.422 | |
| 1:04.469 | ||
| 1:10.781 | 6.312 | |
| 1:14.984 | ||
| 1:39.297 | 24.313 | |
| 1:44.219 | ||
| 1:51.203 | 6.984 | |
| 1:57.500 | ||
| 2:17.328 | 19.828 | |
| 2:24.859 | ||
| 2:30.859 | 6 | |
| 2:56.937 | ugh, lost data pt | |
| 3:01.875 | ||
| 3:09.406 | 7.531 | |
| Avg Fall | Avg Rise | |
| 21.226 | 6.803 |
4b
resistance 1.956
temp 26c
viscosity 1.8520
voltage 500.9
| Time | Fall Time | Rise Time |
|---|---|---|
| 0 | ||
| 23.562 | 23.562 | |
| 31.375 | ||
| 38.234 | 6.859 | |
| 44.703 | ||
| 1:06.656 | 21.953 | |
| 1:12.625 | ||
| 1:19.703 | 7.078 | |
| 1:22.172 | ||
| 1:47.297 | 25.125 | |
| 1:50.953 | ||
| 1:58.109 | 7.156 | |
| 2:04.391 | ||
| 2:33.422 | 29.031 | |
| Avg Fall | Avg Rise | |
| 22.417 | 7.031 | |