Physics307L:People/Young/Formal
SJK 18:26, 7 December 2008 (EST)

Hey Dan, This is a good first draft of the formal report. A lot of what you have is very good, but a lot is missing too. For example, your figures for your data are going to be very nice, but as of now, they do not have numbers or captions and so they are ineffective. Another big component that is missing is citations to peer-reviewed primary research articles. Note also that Michael is doing this experiment for his formal report and the equipment is dying. The two of you can consult with each other and me as to what to accomplish on Wednesday for further data (I discussed some ideas on his formal report page.
e/m Ratio using Electron Diffraction
SJK 17:59, 7 December 2008 (EST)

This title is incorrect! No electron diffraction in this lab! You should put Arianna's full name, and you can replace the date of the experiment with your email address or some other way to contact you. (That is the purpose of the contact information.)
Author: Daniel Young
Experimentalists: Arianna and Daniel Young
Location: UNM Department of Physics, Albuquerque, New Mexico, United States
Date of experiment: September 19, 2008
Abstract
SJK 18:02, 7 December 2008 (EST)

This first sentence is out of place in the abstract (also the light is cyan, not purple!). You could replace it with an introduction sentence or a motivation sentence. The other sentences are pretty good. But missing is a concluding statement. You can put in your final number with uncertainty and a comment about whether it's consistent with the accepted value.
We start with an electron gun consisting of a heater and some potential plates to create a constant stream of electrons that will appear as a purplish light when transmitted in a helium filled glass bulb. To find out the charge over mass ratio of the electron beam we will introduce a constant magnetic field perpendicular to the beam path using a set of Helmholtz coils that surround the apparatus. First we will measure the various radii of the electron beam by varying the accelerating Voltage in the electron gun for a fixed magnetic field. Second we will vary the B field and measure the resulting radii. The magnetic field will be changed by changing the current through the coils solely. Thirdly we will vary both magnetic field and accelerating Voltage and measure their effects on the radii of the electron beam.
Introduction
SJK 18:06, 7 December 2008 (EST)

This introduction is much too short, as I'm sure you know. What you have so far is good content and would make up the motivation part of your introduction. (i.e., why is this ratio important). You will want to add: (1) information about how this ratio is best measured today, along with citations to primary research papers, (2) information about the currently accepted value and reference to where you get that, (3) then a concluding part of your introduction where you say what you'll be reporting in this paper.
In our experiment we hope to find an experimental value for the ratio of charge over mass for an electron. The electron charge over mass ratio is a well known value that we hope to confirm using the most practical methods available in out Lab. The electron is a fundamental building block of the atom. To understand more about the electron would mean a greater understanding of atoms and the interaction they undergo. Also the value of an electrons charge and mass is invaluable to other experimenters who wish to use electrons in any part of their experiment.
Methods and Materials
SJK 18:12, 7 December 2008 (EST)

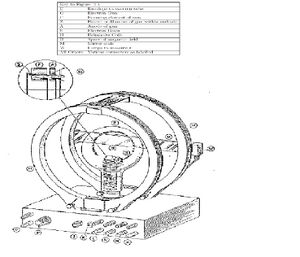
You will need to convert this section from a list to prose about what you actually did. This will be written in the past tense, e.g. "we used a e/m apparatus (company name, city) which included a helium bulb with an electron gun, ..." etc. Also, a photograph and / or a diagram would be a valuable component of this section. You have a figure now, but I don't think it conveys much useful information. You could use powerpoint to add other components to that diagram and show how the connections are made. Or you could take a photo and then use a drawing program to add text explanations. When you do so, make sure to number the figure and add a caption too!
Materials

- 1 High Voltage power supply 5 kV max for the accelerating plates in the electron gun
- 1 Low Voltage supply voltage 2.5V for the Helmholtz Coils
- 1 Low Voltage supply not to exceed 6V for the Heater in the electron gun
- banana plugs
- multimeter's to monitor current and Voltage
- air tight Helium gas filled bulb
- electron gun
- Helmholtz coils
Calibration
- All of the power supplies are connected to Voltmeters and Ammeters to ensure that the values we view on the power supplies are correct.
- if the bulb is turned too much one way or the other the beam can make a Helix rather than a loop so we made sure to line the beam up completely perpendicular to the appaeratus before taking measurements.
Derivation of e/m Relation to our input
SJK 18:14, 7 December 2008 (EST)

This theory is a good part of your analysis methods. You just need to add description of the software and algorithms you used, e.g., "we used Matlab (Mathworks, cityname) to perform linear least squares fitting with the ___ routine...etc."
Relation of charge over mass ratio using forces.
[math]\displaystyle{ F_e = ma \ }[/math]
[math]\displaystyle{ B_Hq = \frac{mv}{r} \ }[/math]
Relation of charge over mass ratio using Energy
[math]\displaystyle{ KE = eV \ }[/math]
[math]\displaystyle{ \frac{1}{2}mv^2 = qV \ }[/math]
Where,
- [math]\displaystyle{ V \ }[/math] is the accelerating Voltage in Volts
- [math]\displaystyle{ v \ }[/math] is the velocity of the electron in m/s
- [math]\displaystyle{ q \ }[/math] is the charge which in this case is the charge of an electron
- [math]\displaystyle{ m \ }[/math] is the mass of an electron which is
- [math]\displaystyle{ B_H \ }[/math] is the B field produced by the Helmholtz coils in (V s/m²)
- [math]\displaystyle{ r \ }[/math] is the radius of the electron beam path in meters
The general form of the equation for a Helmholtz coil is [math]\displaystyle{ B_H = \frac{\mu_0 I R^2}{2(R^2+x^2)^{3/2}} }[/math]
We will estimate that the value for x is about R/2 within for our electron beam.
After simplifying all of our equations we have
- [math]\displaystyle{ \frac{q}{m} = (\frac{5}{4})^3 \frac{2V(R^2)}{{\mu_0}^2 n^2 I^2 r^2} \ }[/math]
Where,
- [math]\displaystyle{ R \ }[/math] is the Radius of the Helmholtz coils which is .15 meters
- [math]\displaystyle{ \mu \ }[/math] permeability of free space 1.2566371 × 10⁻⁶ (N/A^2)
- [math]\displaystyle{ n \ }[/math] is the number of loops in the Helmholtz coils which is 130
- [math]\displaystyle{ I \ }[/math] is the current through the coils
Results and Discussion
SJK 18:15, 7 December 2008 (EST)

Looking at this paragraph, it seems to belong in the Methods section.
Actually, it seems that most of your text in this section is actually describing methods versus describing results. For example, you will need text such as, "Figure ___ shows the data we obtained at constant current while varying the accelerating voltage. Also shown is the resulting best fit line (solid black line) using linear regression...etc." Also as mentioned elsewhere, you will need to number the figures and tables and add descriptive captions.
I started by setting up the Power supplies to their respective slots with the banana plugs. All power supplies are connected to Multimeter's. The Helmholtz coils Multimeter is set up in series with the apparatus and the other power supplies are set up in parallel with the apparatus. The heater power supply Voltage, Helmholtz coil radius and number of loops are all held constant. The only possible variables are the accelerating Voltage and the Helmholtz coil current.
Vary Current
SJK 17:57, 7 December 2008 (EST)

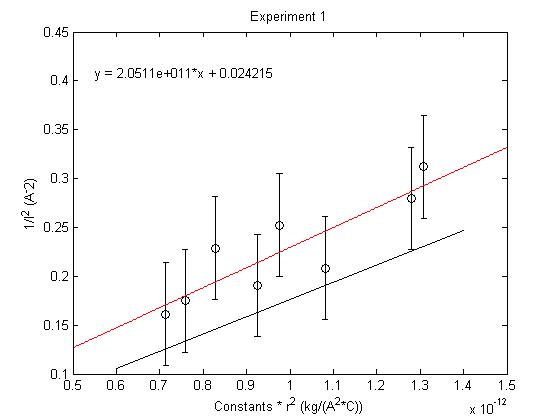
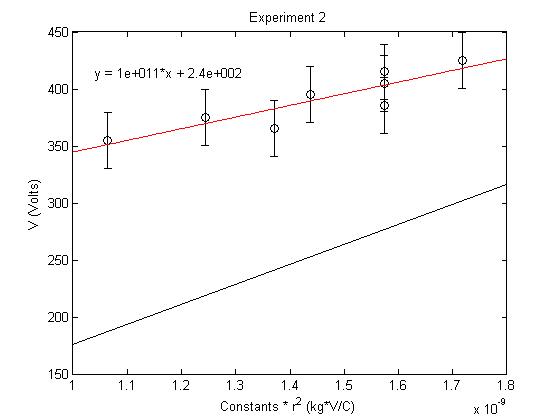
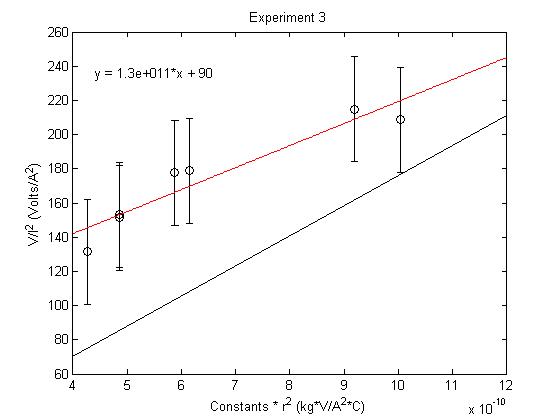
These figures look very nice. However, without figure captions, I cannot understand what all the lines mean. You will need to (1) number the figures (2) put in descriptive figure captions (e.g., "The open circles represent the mean of x# measurements and the error bars represent the standard error of the mean (see methods)...the solid black line represents blah blah blah...) and (3) refer to the figures by number in the text.

While keeping the Voltage constant we start with a large radius (High Current) and then lower the Current by small increments so we can measure the resulting radius of the electron Beam. Here the Magnetic field delegates the radius of the beam.
Since we are holding the Voltage constant.
- [math]\displaystyle{ r^2 \propto \frac{1}{I^2} }[/math]
Constant Voltage: 449.3V
| Current (A)±.01 | Radius(cm) | error in Radius(±cm) |
| 2.491 | 3.25 | .1 |
| 2.391 | 3.35 | .1 |
| 2.291 | 3.70 | .1 |
| 2.191 | 4.00 | .1 |
| 2.09 | 3.5 | .1 |
| 1.991 | 3.8 | .1 |
| 1.891 | 4.35 | .1 |
| 1.790 | 4.4 | .1 |
Vary Voltage

While holding the Current constant I start with a large radius (High Voltage) and lower the Voltage by small increments and measure the radius of the electron Beam. Here the tangential speed of the electron delegates the radius of the beam.
Since we are holding the Current constant.
- [math]\displaystyle{ r^2 \propto V }[/math]
Constant Current of 1.6A
| Voltage (V)±.1 | Radius(cm) | error in Radius(±cm) |
| 355 | 3.7 | .1 |
| 365.5 | 4.2 | .1 |
| 375 | 4 | .1 |
| 385.5 | 4.5 | .1 |
| 395 | 4.3 | .1 |
| 405 | 4.5 | .1 |
| 415 | 4.5 | .1 |
| 425 | 4.7 | .1 |
Vary Current and Voltage

Now we vary both Helmholtz Current and Voltage.
- [math]\displaystyle{ r^2 \propto \frac{V}{I^2} }[/math]
| Voltage (V) | Current (A) | Radius (cm)±.1 |
| 449.2 | 1.292 | 4.3 |
| 421.1 | 1.400 | 5.5 |
| 401.6 | 1.503 | 4.4 |
| 390 | 1.605 | 4 |
| 380.4 | 1.7 | 3.75 |
| 395 | 1.606 | 4 |
| 405.5 | 1.506 | 4.5 |
| 415 | 1.410 | 5.75 |
The bold value in the table represents an outlier that was removed from the graph. It was the only value that was not within one standard deviation of the predicted slope.
Analysis
SJK 18:20, 7 December 2008 (EST)

the information you have in this section actually belongs in "results and discussion" section.
SJK 17:55, 7 December 2008 (EST)

I notice that you do not have units on any values from here and below. make sure to put them in your next and final versions!!!
All calculations were made using matlab functions. A least squares fit was used to find the values of the final ratios.
The accepted value for the e/m ratio is
- [math]\displaystyle{ \frac{e}{m}=1.76e11 \ }[/math]
Constant Voltage Vary Current
- [math]\displaystyle{ \frac{e}{m}=2.051e11 \ }[/math]
- σ=0.0526
- sem=0.0066
- %difference from accepted=15.53
Constant Current Vary Voltage
- [math]\displaystyle{ \frac{e}{m}=1.0227e11 \ }[/math]
- σ=24.408
- sem=3.051
- %difference from accepted=41.89%
Vary Current & Vary Voltage
- [math]\displaystyle{ \frac{e}{m}=1.2889e11 \ }[/math]
- σ=30.69
- sem=4.38
- %difference from accepted=26.77%
The value found in the first experiment leads me to believe that it is the most effective way of finding the e/m ratio. The accepted value falls within our 68% confidence interval of our data points. Also this method produced the best percent error and standerd error mean. Experiment 2 where only the current was varied produced the worst results.This leads me to believe that our the assumption of x=R/2 for the entire electron beam made a larger impact than originally predicted.
Conclusions
SJK 18:22, 7 December 2008 (EST)

These thoughts are actually still part of your results and discussion section. The conclusion should be more a final statement about the data (such as, "our final result was inconsistent with the accepted value, due to large unavoidable systematic error...) and comments about the impact and future work (such as" future work would entail...")
Since Experiment 2 produced large standard deviations and ratios that fall outside of the 68% confidence interval I chose Experiment 1 and 3 to be the most effective methods. Using weighted means I will now find the best value for the two values found in the two experiments.
- [math]\displaystyle{ \bar{x} = \frac{w_1 x_1 + w_2 x_2 + \cdots + w_n x_n}{w_1 + w_2 + \cdots + w_n}. }[/math]
- [math]\displaystyle{ w_i = \frac{1}{\sigma_i^2}. }[/math]
Since the standard deviation for Experiment three is so much larger than the standerd deviation for the first experiment the weighing the means shows that the third experiment is negligible in finding the best data point. Therefore my final value will remain.
- [math]\displaystyle{ \frac{e}{m}=2.051e11 \ }[/math]
References
SJK 17:53, 7 December 2008 (EST)

Two of the references (Arianna and me) you can put in an acknowledgments section ("I would like to thank Arianna for..."). Also, you will need to have several references to peer reviewed primary research papers. Most likely, these citations will be in your introduction section.
- Michael Gold, "The UNM Dept. of Physics and Astronomy PHYSICS 307L: Junior Laboratory"(Fall 2006),experiment 5 (page 31-40)
- Arianna Pregenzer-Wenzler Lab partner
- Stephen Koch , data analysis lectures here
- Taylor, "An Introduction to Error Ananlysis, 2nd edition" (1997, University Science Books), page 174-176