Fiddle with the oscilloscope settings so you can see the sine wave on the screen.
Got sine wave
Came up with no extra work.
Measure characteristics of a sine wave
Measure peak to peak voltage (thus amplitude) and measure the period (thus frequency)
First, use the grid on the oscilloscope screen ("divisions" are the dotted lines)
Peak to peak voltage
150mV
Next, use the cursors
Peak to Peak
84mV-(-66mV)= 150mV
Finally, use the "measure" functions.
Peak to peak voltage
152mV
Repeat this for a few different waves: Very large amplitude; very low amplitude; large DC offset
For lowest amplitude on wave generator: see comment
Steven J. Koch 14:29, 28 August 2007 (EDT):Good job with these measurements! In the future, one way to be able to estimate the error in your measurements would be to try to independently repeat the measurement at least three times.
Read 62.0mV peak to peak voltage using measure function
Using grid 60mV
Cursor reading 60mV
For highest amplitude on wave generator:
Read 2.2V Peak to peak voltage using measure function
Using grid ~2.2V
Cursor reading 2.16V
Are there waveforms that the oscilloscope cannot measure properly?
see comment
Steven J. Koch 14:29, 28 August 2007 (EDT):My guess is that it has a problem triggering...also, you may have found that the oscilloscope cannot measure very large voltages (the peaks of waves would start to get chopped off)
As the frequency approaches zero the scope seems to have a problem displaying the wave.
Common way to trigger is on a rising edge (what does this mean?). What happens to the signal when you use different triggers? Be able to explain this orally.
The rising edge is the point on the wave where the slope is positive. Therefore it starts you
on the upswing of the curve.
Edge gives a stable sine wave with 2 periods displayed an averaged view of the wave form.
Video shows the wave oscillating and moving across the screen as the wave is detected.
Pulse gives a view of the wave at a rate of 1 ms.
Apply a large DC voltage to the oscilloscope input (we'll have to figure out how to do this). Compare DC coupling with AC coupling. You may need to adjust the triggering. Which mode is better for viewing any "ripple" on the DC voltage?
Edge triggering is better for viewing the "ripple" because it is a static image therefore easier
to take measurments on.
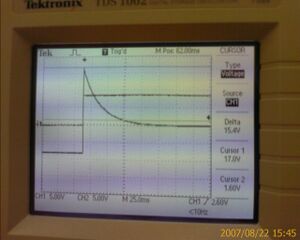
Using rising part of square wave to measure fall timeMeasure the fall time of the AC coupling
Function generator: Square wave; zero DC offset; amplitude about 8.6 V
Use cursors to measure fall time (peak to 10% value)