Physics307L:People/Ritter/Planck
Planck's Constant
To view the exact procedure for this lab or to learn more about the apparatus follow the given link to last year's manual.[1]
Purpose
In this lab we will be using an Hg vapor light source to ultimately determine the value of Planck's constant. In addition, we will look into the differences between the classical and quantum perspectives of light. In Experiment 1 we look at different intensities of light, which according to the classical model should be the main determination in a photons maximum kinetic energy. Our findings, however, should prove the quantum perspective that a photons energy is based only on it's frequency.
Equipment and Setup
SJK 22:12, 18 November 2007 (CST)

You will need actual make and model numbers for your formal report.
Our experimental setup includes a mercury vapor light source, an h/e apparatus, and a digital voltmeter. At one point we also used an oscilloscope for our data collection (more on this in the Conclusions section). To properly measure the yellow and green lines a filter will be necessary. Experiment 1 also requires the use of a relative transmission filter in order to measure different intensities.
Data Collections
SJK 22:08, 18 November 2007 (CST)
need a link to where the raw data was collected (your primary notebook or Antonio's)
Experiment 1
The h/e apparatus collects the monochromatic light from the Hg vapor light source and the associated photoelectrons are ejected from the cathode to the anode. This slight current eventually stops and the anode-cathode potential stabalizes. In this part of the experiment we will be measureing the time it takes to reach this point.
Yellow Emission Line

Stopping Voltage 0.724V
| Trans % | Time 1 | Time 2 |
| 100% | 8.3s | 9.2s |
| 80% | 11.5s | 11.4s |
| 60% | 16.5s | 16.9s |
| 40% | 18.0s | 19.2s |
| 20% | 43.4s | 40.6s |
Green Emission Line
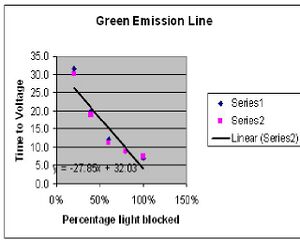
Stopping Voltage 0.849V
| Trans % | Time 1 | Time 2 |
| 100% | 6.9s | 7.5s |
| 80% | 8.7s | 8.7s |
| 60% | 12.0s | 11.2s |
| 40% | 19.9s | 19.0s |
| 20% | 31.6s | 30.2s |
Experiment 2
In this portion of the experiment we measure the stopping voltage associated with a given wavelength of light. This relationship should give us what we need to determine the value of h.
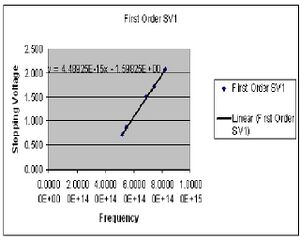
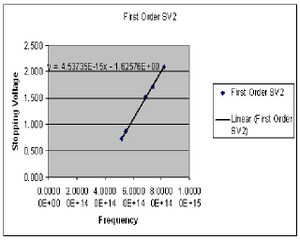
| Color (1st order) | Potential 1 (Volts) | Potential 2 (Volts) |
|---|---|---|
| Yellow | .724 | .720 |
| Green | .859 | .869 |
| Blue | 1.502 | 1.510 |
| Violet 1 | 1.732 | 1.720 |
| Violet 2 | 2.078 | 2.078 |
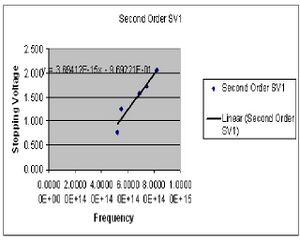
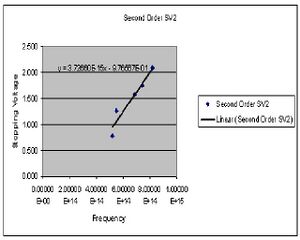
| Color (2nd Order) | Potential 1 (Volts) | Potential 2 (Volts) |
|---|---|---|
| Yellow | .778 | .786 |
| Green | 1.255 | 1.270 |
| Blue | 1.574 | 1.583 |
| Violet 1 | 1.735 | 1.752 |
| Violet 2 | 2.064 | 2.086 |
Calculations
The value of h is determined by preforming four least square fits to the collected data points for both first and second order. The slope of this line gives the ratio of h/e. At this point I chose to summarize my data for the first and second order data separately after seeing a fairly large discrepancy between the two sets. Here then I have the derived values of h for both first and second order.
Final value for h 1st order
7.2311E-34(J*s)
standard deviation of 3.854E-36
standard error of +/-1.839E-36
Final value for h 2nd order
5.944E-34(J*s)
standard deviation of 2.601E-36 SJK 22:15, 18 November 2007 (CST)
Good job putting units on final answer. The standard dev. and error need units too! In your final report you will put your values in your abstract (and also in results section)...write them as (value +/-) *exponent units
standard error of +/-2.724E-36.
Conclusions
1.) Measuring rise-times - measuring rise times was initially very difficult. Looking at previous lab reports led Antonio and myself to believe that rise times would be relatively quick. Assuming this to be the case we experimented with the use of an oscilloscope. This proved to not be very effective, but led us to investigate further. The website for the used h/e apparatus supplied us with the needed information. Rise times would actually be much longer possibly up to a minute in duration. Follow the given link to more information on expected rise times"Pasco h/e AP-9370A instruction manual".
2.) First and Second order data - It would have seemed as though the first and second order data should have produced similar results. this was not the case however. Averaging all of my data would have produced a value for h that was much closer to actual value then either of my two separate values. If there is an obvious difference between two sets of data, even if they are supposed to produce similar results, it didn't seem appropriate to use them together for a final calculation. There was some sort of systematic error in one or possibly all of our sets of data. The average of all four sets with this error included, while closer to the real value, wouldn't make that much sense.SJK 22:07, 18 November 2007 (CST)
I agree with you it doesn't make sense to average together data that are clearly representing two different parent distributions. What do you think is going on? Which data produce an h value closer to the accepted value? The y-intercept provides you with the work function...how does that differ in the two data sets?
Quick Koch comments
- Good data, good analysis. You still didn't link to your primary lab notebook, though! See previous lab grade email for details about that.
