Physics307L:People/Le/Notebook/071001
Calculations
--Linh N Le 15:54, 1 October 2007 (EDT)
Part 1
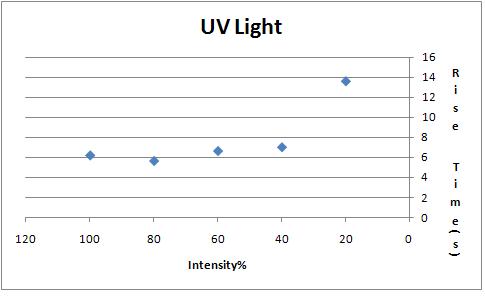
In the first part of the lab, we measured the time it took to return to a certain % of the stopping potential for different wavelengths of light and for different intensities of said light. Since light acts like a particle, we surmised that halving the intensity of the light (thus halving the amount of packets that enter) would double the rise time.
UV Light
http://openwetware.org/images/f/ff/Uvplot.jpeg
As we can see, from 100% intensity to 40% intensity, the rise time only increased very slightly. This could have been a problems with the fact that our intensity filter, filtered out UV light.
Blue-Violet Light
http://openwetware.org/images/f/fe/Bluevioletlight.jpeg
It too, is not linear. It actually looks more exponential. The graph for Blue light is the same shape as the UV light, although the scale is different.
Green Light
http://openwetware.org/images/2/23/Greenlight.JPG
Once again, an "exponential" looking plot.
Yellow Light
http://openwetware.org/images/6/6b/Yellowlight.JPG
Woah! That's some weird looking data. Our apparatus was having trouble at the very end of the experiment last week, so we are going to retake this data.
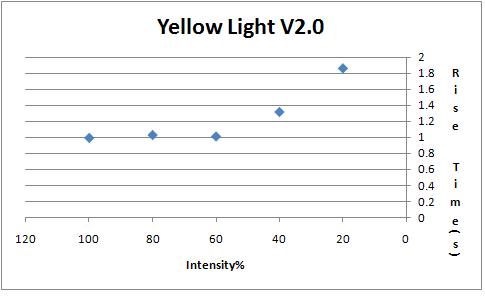
http://openwetware.org/images/2/29/Yellow2.JPG
This one looks more consistent with the rest. I would like to note that 60% is still a smaller time than 80% and 40%. This happened twice.
Part 2
In this part, we find Planck's Constant and the work function of the apparatus using our stopping potential, the frequency of the light and plotting the linear function:
[math]\displaystyle{ K=h \nu - \phi }[/math]
Where K is the kinetic energy of the electrons popped off, h is Planck's constant(found by slope of graph), [math]\displaystyle{ \nu }[/math] is the frequency of the light and [math]\displaystyle{ \phi }[/math] is the workfunction of the metal(found by y-intercept of graph).
Wavelengths and frequencies taken from last year's lab notebook
According to this website:http://dev.physicslab.org/Document.aspx?doctype=3&filename=AtomicNuclear_PhotoelectricEffect.xml
We can calculate the KE of the electron by multiplying the charge of an electron by the stopping potential, plot all our KE's vs Frequencies and using the slope and Y intercept, find the values we want
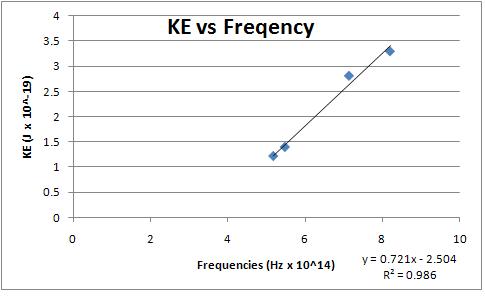
Example Graph:
 Photoelectric Effect/Stopping Potential Relations
UV
Wavelength about 365nm
Frequency about 8.2E14 Hz
Stopping Potential(1) 2.06
KE(1)=3.300E-19J
Stopping Potential (2) 2.07
KE(2)=3.316E-19J
Avg Stopping Potential 2.065V
Avg KE=3.308E-19J
Blue-Violet
There were 3 lines, blue, indigo and violet. We picked the middle line, indigo.
Wavelength about 420nm
Frequency about 7.14E14 Hz
Stopping Potential (1)1.76V
KE(1)=2.819E-19J
Stopping Potential (2)1.76V
KE(2)=2.819E-19J
Avg Stopping Potential: 1.76V
Avg KE=2.819E-19J
Green
Wavelength about 546nm
Frequency about 5.48E14 Hz
Stopping Potential (1).89V
KE(1)=1.43E-19J
Stopping Potential (2).86V
KE(2)=1.377E-19J
Avg Stopping Potential=.875V
Avg KE=1.40E-19J
Yellow
Wavelength about 578nm
Frequency about 5.18E14 Hz
Stopping Potential(1):.75V
KE=1.20E-19ev
Stopping Potential:.76V
KE=1.21E-19ev
Stopping Potential:.75V
KE=1.209E-19ev
Graphs
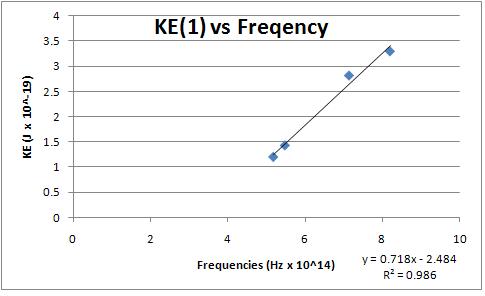
Taking the KE's from the first order voltages
http://openwetware.org/images/9/95/Placks_1.JPG
Y intercept=workfunction=2.484E-19 J
Slope=Planck's Constant=7.18E-34Js
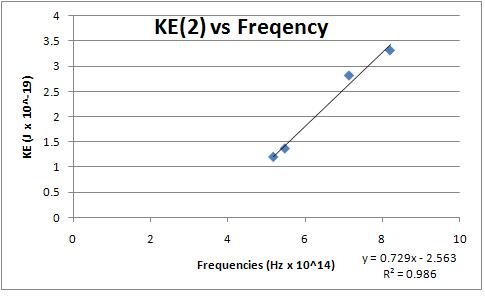
Taking the KE's from the 2nd order voltages
http://openwetware.org/images/5/59/Plancks_2.JPG
Y intercept=workfunction=2.563E-19 J
Slope=Planck's Constant=7.29E-34Js
Taking the average of the voltage, to find the average KE
http://openwetware.org/images/f/f0/Plancks.JPG
The Y-intercept=workfunction=is 2.504E-19 J
The slope is =Planck's Constant = 7.21E-34 Js
Error Analysis
SJK 01:20, 18 October 2007 (CDT)

This all looks great! However, it would be nice to put a concise statement of the best answer +/- uncertainty in the summary. Otherwise, the answer is buried in these calculations and not easy to find.
Mean of Planck's Constant= [math]\displaystyle{ \frac{7.21x10^{-34} + 7.29x10^{-34} + 7.18x10^{-34}}{3}=7.22x10^{-34} }[/math]
Standard Deviation [math]\displaystyle{ \sigma = \sqrt{\frac{1}{N} \sum_{i=1}^N (x_i - \overline{x})^2}. }[/math]
[math]\displaystyle{ \sigma = 4.64 x 10^-{36} }[/math]
Standard Error :[math]\displaystyle{ s = \sqrt{\frac{1}{N-1} \sum_{i=1}^N (x_i - \overline{x})^2} }[/math]
s= [math]\displaystyle{ 5.68x10^{-36} }[/math]
- [math]\displaystyle{ SE = \frac{s}{\sqrt{N}} }[/math]
[math]\displaystyle{ SE=3.28x10^{-36} }[/math]
[math]\displaystyle{ %error= \frac{|Actual-Experimental|}{|Actual|}x100 }[/math]
Using the Mean for Planck's
[math]\displaystyle{ %error=9.06% }[/math]
Sources of Error
SJK 01:19, 18 October 2007 (CDT)
Also, probably there is some problem with method for measuring charging times.
- Light from outside can enter the apparatus and skew the light we are measuring
- Although using a filter for green and yellow, it is not a perfect filter and other colors of light may still get through
- The voltmeter may not be 100% accurate (it showed a .04V even while not connected to anything)
Summary
SJK 01:18, 18 October 2007 (CDT)
Very nice data, very nice lab notebook (recording of the data), and excellent use of graphs and error analysis. The main thing lacking is the summary and a discussion of the results. For example, the rise time analysis did not work out as expected...why do you suppose this is? Can you think of specific things to try to fix this problem? A discussion of this would also show that you understood the theory of what is going on...
A more minor point is that I would like the summaries to be here: Physics307L:People/Le
You can find the first week's work here. This is where the procedure and initial data were taken.
As for the lab as a whole, there was not alot of error to be found. The big sources and some data analyses are listed above. Since there was not alot of "interaction" I feel that this lab was a bit lacking. I had very little control on how things were measured.
Although the design was ingenous, I would have liked to do this lab "the old fashioned way" (ie turning a dial that adjusts the voltage and finding the stopping potential where current=0).
