Physics307L:People/Josey/Poisson Distribution
Steve Koch 03:09, 21 December 2010 (EST):Good summary and good job turning this into your formal report.
Poisson Distribution
For this experiment, Kirstin and I measured the background radiation in the lab and used it to demonstrate the Poisson Distribution. My notebook and data for this experiment can be found here. The Poisson distribution is used when a process occurs randomly, but with a definitive overall rate. Mathematically, this represented as:
[math]\displaystyle{ P_\mu (\nu) = e^{-\mu} \frac {\mu^{\nu}} {\nu !} }[/math]
Where:
- P is the probability of ν counts in any definite interval,
- μ is the expected mean number of counts, and
- ν is the number of counts in the interval.
To demonstrate this, we counted the number of events in a specified time window repetitively, on the order of 2500 windows. We then changed the size of the window in steps from 10 ms to 1 s. From these we calculated the average number of counts per window and their standard of mean directly from the data. We also calculated the square root of average. The reason for this is that the square root of the average is the standard deviation, and uniquely shows the Poisson distribution. Here is our calculated values, plus the percent difference between the two standard deviations:
From the data, it is clear that the standard deviations in the data and the square root of the average never significantly differ, keeping a percentage error within 1.5%. Because of this fact, it is clear that the data we collected in the lab very closely follows the Poisson distribution.
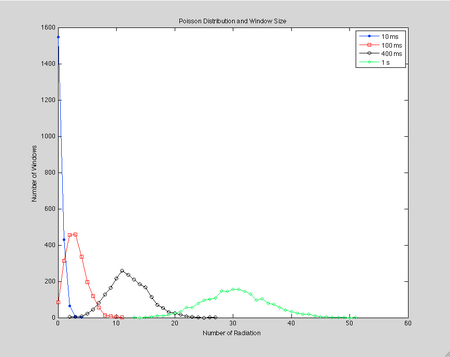
Also, our data passed a qualitative check. As the window size increased, so did the standard deviation. When the number of windows is plotted against the number of radiation per window, the graph spreads out and lowers its peak as the window size increases. Here is a graph of several of our data sets illustrating this behavior:
