Physics307L:People/Barron/labsum~poisson
Poisson Statistics Lab Summary
Here is the lab manual page.
Here are my lab notes.
Partner: Justin Muehlmeyer
Introduction
This lab is set up to count the number of "hits" created in a scintillator/photomultiplier tube setup due to cosmic radiation. The idea is that the average rate of hits is fairly constant, so a Poisson probability density function should describe histograms of the data well. In the lab, we test several dwell times (1 ms, 10 ms, 100 ms, 1 s, and 2 s) with 512 passes each using a Multichannel Analyzer Card (MCA) and tailored software. See our notes for setup instrumentation details.
We had significant troubleshooting problems for most of our prescribed lab time, and had to switch out many components to get the whole setup working. In the end, instead of getting solid voltage peaks in our oscilloscope, we got a "derivative signal" - roughly what the graph of a derivative of a Gaussian would look like. We decided this should not matter, since all we are counting are events themselves, and not the quality of events.
Approach
The goal of this lab is to see whether the frequencies of cosmic ray interactions with a scintillator over several different dwell times follows a Poisson distribution. They should by definition, assuming that the average rate of cosmic ray detection does not change over time. To test this hypothesis, I created separate histograms of event counts, calculated the mean of each (with error), and used said means to fit a Poisson distribution over the histogram for each dwell time. I then compared the Poisson fit with a Gaussian fit for each dwell.
Final Results
SJK 10:10, 20 October 2008 (EDT)

I think you used "lambdaerror" without understanding what it is or should indicate!
| Dwell Time Δt | Frequency Count λ | λerror |
| 1 ms | λ = 0.013671875000000 | 4.059741317917446e-07 |
| 10 ms | λ = 0.126953125000000 | 2.975294357739427e-04 |
| 100 ms | λ = 1.294921875000000 | 4.620595463752644e-04 |
| 1 s | λ = 13.488281250000000 | 3.259048960726763e-04 |
| 2 s | λ = 25.361328125000000 | 2.425961354924050e-04 |
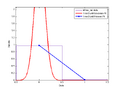
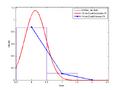
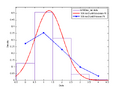
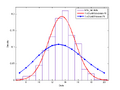
Gaussian vs. Poisson Fit
|
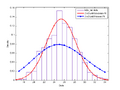
SJK 10:09, 20 October 2008 (EDT)
I agree that the Poisson doesn't fit well for larger dwell, and I think there may be a problem with your formula. OR as I see now from Justin's report, I guess perhaps the data are not Poissonian???
Clearly, the Poisson fit mirrors the data distribution for small dwell, then degrades over time. The Gaussian begins badly, then comes into its own with larger dwell. It looks as though the two fitted distributions might "merge" farther down the road. It would be interesting to see if they approximate each other for extremely large dwell time - this would be something good to investigate in a final lab report.
