OpenWetWare:ALS
Amyotrophic lateral sclerosis (ALS) is a form of motor neuron disease; the nature of it is highly selective loss of both upper and lower motor neurons (Rabin et al. 2009). ALS is a progressive, fatal, and adult-onset neurodegenerative disease caused by the degeneration of the nerve cells in the central nervous system, and selectively kills brain and spinal cord motor neurons. Moreover, ALS can be divided into two forms: an inherited form (familial ALS) and non-inherited form (sporadic ALS); approximately 5~10% of individuals with the former form. Nevertheless, around 20 per sent of the familial ALS result from Cu/Zn superoxide dismutase 1(SOD 1) enzyme defected on chromosome 21(coding for SOD) (Rosen et al. 1993). Briefly, only 1~2% of people suffer from SOD1 mutation; in other words, most ALS do not have a known genetic basis.
Introduction
SOD1
SOD1 is a critical enzyme of an ALS-associated protein involved in the protection of mitochondria against oxidative stress especially in Familial FALS. Moreover, SOD1 results in gain in function instead of normal, compared with non-mutant SOD1. For those mice that lack the SOD1 gene do not develop ALS entirely, though they truly have a shortened lifespan. For human beings, children are diagnosed with higher risk factor for developing the FALS in North America (Pradat et al. 2010)
Gaussian Graphical Models (GGMs)
Two main approaches to reconstruct gene regulatory networks from microarray data are Bayesian networks and Gaussian Graphical Models (GGMs). The former are directed acyclic graphical models but computationally intensive that there is no R especially for large-scale gene network, the latter are undirected graphical models but computationally efficient with a R package for gene network reconstruction, namely GeneNet. GeneNet is a package of R for learning high-dimensional dependency gene networks with edges and nodes from genomic data. According to (Werhli et al. 2006), both methods provided similar results for reconstructing gene networks based on observed microarray data. I therefore chose GGMs as it particularly suits ‘small N, large P’ data sets; sample size N is much smaller than the total number of genes P.
GGMs are undirected probabilistic graphical models that assume a family of multivariate nomal distribution with constrained original data constrained to satisfy the pairwise conditional independence restrictions among the nodes inherent with cutoff in the independence graph to study interaction between genes. The assumption of GGMs is based on an estimation of the covariance matrix of normal distribution.
Pearson correlation coefficient is used in GGMs for calculating covariance matrix between two genes. Three interactions between genes can be indicated: 1) direct interaction, 2) indirect interaction, 3) the regulation of the two genes by a common gene. In terms of network reconstruction, I only focus on direct interactions represented by the partial correlation matrix.
Aim for this project
The aim of this project, firstly, is to reconstruct the co-expression networks of ALS in neurons of mutant SOD1 transgenic species with expressing active mice (SOD1 G37R) or inactive mice (SOD1 G85R) SOD1 mutants as well as rat SOD1G93A mutants. Those with enzymatic activity or without activity SOD1 were both demonstrating the ability to cause ALS, even it remains unclear how and whether dismutase activity SOD1 can influence disease phenotype(The effect of mutant SOD1 dismutase activity on non-cell autonomous degeneration in familial amyotrophic lateral sclerosis.). The reconstruction of gene networks from microarray data use Gaussian Graphical Models (GGMs) by GeneNet R package, which can be regarded as model and analyze gene expression data in a form of time series (Schäfer & Strimmer 2005). Secondly, identifying genetic interactions from transcriptomic data and analyze the resulting networks by GO terms. The unknown genes were predicted with candidate genes of high correlation. The profile candidate genes were identified based on the report (Lobsiger et al. 2007a), Cd11b, Iba1, EAAT2, EAAT3, p75 and Isl1. Alteration of these set of gene in the networks can be identified for therapies at the simultaneous interception of damage in inherited ALS.
Process
The raw data of SOD1 species for this project was based on the paper of “Toxicity from different SOD1 mutants dysregulates the complement system and the neuronal regenerative response in ALS motor neurons”, and further analyze the transcriptomic data and resulting networks of mouse and rats. The networks only focus on the gene with assigned probe sets of gene chip; those unassigned probe sets were excluded.
The microarray expression data are transformed from the raw microarray images by log for satisfying the nature of experimental errors. affy R package is mainly adopted to analyze Affymetrix microarray data sets by reading and converting raw Affymetrix CEL files into expression values and safe them into a CSV file. The CSV file contains expected value of two time points with duplicated experiments distinguished by mutant and wild type microarray in mouse; one time point in rats.
Glutamate (excitotoxicity) is one of the chemical messengers or neurotransmitters in the brain. Compared to healthy people as what scientists have found, higher levels of glutamate are returned at ALS patients in the serum and spinal fluid (Al-Chalabi & Leigh 2000). There are five Na+-dependent glutamate transporters (EAATs) have been identified, those of which located on the plasma membrane of neurons and glial cells and have been implicated in ALS. I found that the glutamate transporter EAAT2 (SLC1A2) presented in the network of mutant SOD1G37R gene associated with MOE430B annotation files of significant 50 edges counted from the lowest p-value, but absented in the wild type network with same gene and same annotation file. EAAT2 could be a crucial factor that affects the ALS. Moreover, EAAT2 absented in both mutant and wild type of SOD1G85R gene attached with MOE430A annotation file of significant 50 edges. However, one other glutamate transporter like EAAT3 (SLC1A1) absented in the network of both mutant and wild type gene with corresponding MOE430A and MOE430B annotation file. The results of glutamate transporter EAAT2 and EAAT3 were reversed with another report (Lobsiger et al. 2007b).
Gene EAAT2 was identified on the report of (Lobsiger et al. 2007b). It was presented in the network of mouse with MOE430B annotation file and categories GO term of transporter activity that further proves the possibility of implicated in ALS. For EAAT3, the correlation between nodes was presented non-correlated that no network created of significant 50 edges.
Results
Find EAAT2 in the mouse with Ontology of MF
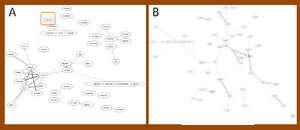
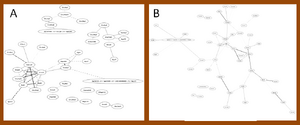
In mouse, EAAT2 has been found only in the network with the mutant SOD1G37R of significant 50 edges, but absented in the network with same legend of wild type SOD1G37R (Figure 1). EAAT2 did not present in the networks of significant 50 edges neither in mutant SOD1G85R nor in wild type SOD1G85R data sets (Figure 2). SLC gene family were strongly present in the networks of both SOD1G37R data sets and SOD1G85R data sets.
Candidate gene in the network with Ontology of BP in mutant SOD1G93A rats
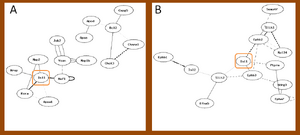
Further prove that candidate genes were presented in the network of significant gene area in rats. Three candidate genes (Cd11b, Isl1 and p75) were found in the networks of significant 20 or 50 edges. Gene Cd11b was presented in the networks of process integrin-mediated signaling pathway and leukocyte cell-cell adhesion. Gene Isl1 was presented in that of axon regeneration and retinal ganglion cell axon guidance. Gene p75 only presented in the network with inflammatory response of significant 50 edges. And gene EAAT3 presented in the network with transport, but beyond of significant 1000 edges. Other biological process either attached with too few probe id or did not presented of significant 2000 edges. Figure 3 showed where Isl1 was located and the correlation with other genes. Nevertheless, no correlation between Isl1 and other genes were connected with same edge in both networks, though some genes were returned.
The correlation between candidate genes and individual GO terms in rats
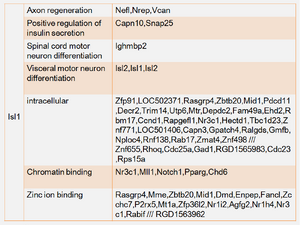
Not all the candidate genes can be found in the distribution network with 0.05 cut off. Some of them against GO terms have high correlation that would not find out in the network of significant edges. Compared with correlation distribution filtered by GO term, the density that the candidate genes located in the subset network is higher or lower, individually. Figure 4 to 6 shows the distribution of the candidate gene in the subset networks. The unknown gene was therefore pointed out with specific threshold for each subset, and the summary of unknown genes to the candidate gene was displayed at table 1. File:Cd11b 2.pdf File:Isl1 2.pdf File:P75 1.pdf
Materials
Affymetrix GeneChip raw data (CEL-files) of rodent models were extracted from http://arrayconsortium.tgen.org (accession nos. lobsi-affy-mouse-193446 and lobsi-affy-rat-194438) and are available through the Gene Expression Omnibus (GEO) database, www.ncbi.nlm.nih.gov/geo. After decompressing the zip folder, three files (CEL, CHP and EXP) were included with individual SOD1. CEL file was only used in this project. File “lobsi-affy-mouse-193446” includes mutant and wild type for both active SOD1G37R and inactive SOD1G85R mice data sets. And file “lobsi-affy-rat-194438” contains mutant, wild type, and negative control for SOD1G93A rat data sets.
The corresponding NetAffx annotations are MOE430A, MOE430B and Rat_230_2 where can be downloaded from http://bioconductor.org/packages/release/data/annotation/ (Affymetrix, Inc., Santa Clara, CA) or through AffyCompatible R package. Current NetAffx annotation version files for MOE430A and MOE430B are both released from 15 November 2009 with release 30, the former annotation file contains primarily probe sets against strong annotated full-length genes while the later annotation file includes probe sets against gene clusters with only EST or non-EST sequences. Current annotation version file for Rat_230_2 is released from 13 November 2009 with release 30.
R packages were downloaded from Bioconductor org, www.bioconductor.org, with the following command of R code on linux. The affy R package can be downloaded with below command and most R packages can be downloaded in this way.
> source(“http://bioconductor.org/BiocLite.R”)
> biocLite(“affy”)
Full ontology file (OBO v1.2) was downloaded on 20 May 2010 from http://www.geneontology.org/GO.downloads.ontology.shtml. OBO v1.2 contains cross-products, inter-ontology links and has part relationships. As ontology file updates daily, it’s better to extract the current ontology file when the file is necessary needed.
Methods
The Affymetrix microarray raw data with CEL files was obtained from the NIH Neuroscience Microarray Consortium, and Affymetrix NetAffx annotation CSV file was downloaded from the Affymetrix NetAffx data base through AffyCompatible R package. Microarray data sets have to be separated into groups with mutant and wild type of corresponding annotation file. Figure 7 shows an example of how individual CEL files divided into groups to create the expression CSV file.
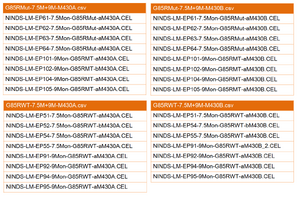
For SOD1G37R gene sets, one NetAffx MOE430A annotation file were attached with mutant or wild type data sets, including two time points (8 week and 16 week) and duplicate microarray experiments with same time point. For SOD1G93A gene sets, one NetAffx Rat_230_2 annotation file were attached with mutant, wild type and negative control data sets, including one time point (14 days) and duplicate microarray experiments. Statistical analysis was performed by seperating from the individual CEL files into two groups, wild type and ALS, and further comparing them to each other, along with same annotation file.
Process
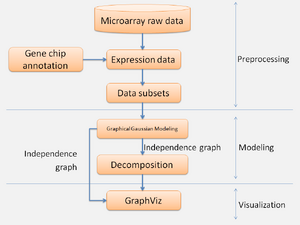
The process can be divided into three stages: preprocessing, modeling and visualization (figure 8). In preprocessing stage, expression data with CSV file was transformed by log from CEL files with different microarray data sets with time points and repeat experiments of same time point. Expression data was analyzed with whole genes or divided into small gene groups according to GO term. In the modelling stage, GGMs were used to reconstruct gene regulatory network from microarray data with whole genes or partial genes. In visualization stage, Graphviz R package was used to visualize the networks with edges calculated by GGMs.
Creating expression data
To read the CEL files and to process Affymetrix probe level data into CSV file by Affy R package is straight forward with the following commands:
> library(affy)
> myExpressionData < - ReadAffy()
> eset < - justRMA
> write.exprs( eset, file=”myExpressionData.csv”)
To load the affy R package and then calculate data with background Robust Multichip Average (RMA) and further output file with CSV format. CEL files were imported into the affy R package with backgrounds underwent RMA and quantile normalizations. Both RMA expression measure and Affymetrix MAS 5.0 algorithms were combined and processed for all Affymetrix CEL files (Rafael A Irizarry et al. 2003). Expression values were obtained by RMA expression measure which consists of 3 particular preprocessing steps: convolute background correction, quantile normalization (B M Bolstad et al. 2003), and summarization by using the median polish algorithm. Default RMA has been used in this project with normalization method quantiles and summarization method medianpolish. RMA has better precision, provided more consistent estimates of fold change, and provided higher specificity and sensitivity when compared with differential expression by using fold change analysis (Rafael A Irizarry et al. 2003).
The next step was converted the content into time series expression data format which was GeneNet R package required and can be recognized only. For mice data sets, it contained two time points with 3 or 4 repeats; while for rat data sets, it contained only one time point with 4 repeats. Far now, the format for CSV file was reversed with the former CSV file, column names with probe id and row names with time points. Either GeneNet R package or longitudinal R package has to be loaded at this step to build time series expression data format. Those unattached gene symbols were excluded.
Analyze whole genes
Each CSV file contains over 20,000 probe ids and data sets of two time points in a mouse or one time point in rats. As GGMs can only simply available for large-scale gene network with limited vector size, a R script was required for computing the Pearson correlation coefficient manually before creating the network by GGMs. Firstly, finding out the maximum and minimum p-value for whole genes by computing matrix over 20,000 from expression data. Secondly, trying different threshold for return gene name with number less than 4000, based on known maximum and minimum of p-value. Last, loading expression data with corresponding gene names and running them in GGMs.
There are two annotation files (MOE430A and MOE430B) associated with mutant and wild type SOD1G85R, while MOE430B or Rat_230_2 was related to SOD1G37R or SOD1G93A, respectively. Take SOD1G85R expression data (includes both mutant and wild type SOD1) with annotation MOE430A file for example. The maximum p-value was 0.9999938 and the minimum p-value was -0.999949. It took over 2 days to compute 22690 matrixes. For 0.9 thresholds for both sides, it returned 22089 genes. For 0.99 thresholds for both sides, 16336 genes were returned. For 0.999 thresholds for both sides, an expected gene numbers were returned with 3979. I reloaded expression data to 3979 genes with 0.999 cut off and run the modified expression data in GGMs. In GGMs, it returned 8,000,000 edges between 3979 gene sets and took around 1600 years to build the giant network on my laptop. I extracted the significant 1000 edges to create the network but could not find out any genes attached to what I am looking for, based on the paper (Lobsiger et al. 2007a). The expression genes I expected were Cd11b, Iba1, EAAT2, EAAT3, p75 and Isl1.
Analyze genes divided by GO term
Enrichment analysis divides genes based on their biological functionality as defined by Gene Ontology (www.geneontology.org), and determined by generating an enrichment score which is equal to the P-value of a χ2 test comparing identified genes.
Before running GGMs, expression data was separated by GO term. I, firstly, only focused on molecular function. GO:0005215 responds to transporter activity and contains term children with 21689 gene products for all species. GO term and its term children were extracted by a script instead of using goTools R package. Amount 944 GO terms were extracted from OBO v1.2 file downloaded from Gene Ontology. These GO ids were attached with corresponding probe id in the MOE430B annotation file, and thus took these probe id to create subset expression data file (0005215_G37RMT-8W+15W-M430B.csv) by matching the probe id in expression data file (G37RMT-8W+15W-M430B.csv). The modified expression data should be less than 4000 gene sets to run the GGMs, otherwise an error of cannot allocate vector of size xxx Mb will present. The file G37RMT-8W+15W-M430B.csv included microarray data sets with mutant SOD1G37R that contains two time points (8 week and 15 week) and repeat experiments (3 repeats for 8 week and 4 repeats for 15 week) in mouse. Other GO terms were running the same steps with different NetAffx annotation file and corresponding expression data CSV file. The gene I focus on were the same as that analyze with whole genes.
For molecular function, only EAAT2 (glutamate transporter) was found in the network of most significant 50 edges with transporter activity and term children in mutant SOD1G37R data sets attached with MOE430B annotation file. EAAT2 did not returns in the network of significant 50 edges with wild type SOD1G37R or even both mutant and wild type SOD1G85R data sets. In the network with significant 50 edges, other candidate genes were hard to find out according to GO terms. Each candidate gene was attached with one or more than one GO term with molecular function. GO term was found in the column in the annotation file with column name “Gene Ontology Molecular Function”. For those numbers of probe id with greater than 4000 were excluded before running by GGMs as an error of cannot allocate vector of size xxx Mb will returns in GGMs.
Next, ontology for biological process was concerned for mutant SOD1G93A rats as these 6 candidate genes were identified in rats according to paper (Lobsiger et al. 2007a). This task compares gene GO terms of whole species with BP to same candidate genes and tries to search the co-expression in the networks. For Cd11b (Itgam), five GO terms are concerned with term number 0050798, 0045123, 0007229, 0007159 and 0030593. For Iba1 (Aif1), two GO terms are concerned with 0005509 and 0051015. For p75 (Tnfrsf1b), seven GO terms have been focused with 0008219, 0008283, 0007166, 0006955, 0006954, 0050728 and 0050779. For EAAT3 (Slc1a1), four GO terms have been focused with 0070779, 0006835, 0006810 and 0051938. For Isl1, fourteen GO terms have been focused with 0031103, 0006091, 0003007, 0048762, 0007275, 0045665, 0001755, 0048663, 0031016, 0021983, 0032024, 0045944, 0006355 and 0031290. Other steps were as same as above analysis experiment. GO term was found in the Gene Ontology website, http://www.geneontology.org/, of whole species. Total 6 candidate genes with corresponding GO term were analyzed.
Last but not least, the analysis of whole 6 candidate genes with corresponding GO terms for BP, CC, and MF were filtered by rats, Rattus norvegicus. To find out the unknown gene related to the candidate gene, analyzing the correlation between each candidate genes with individual GO terms is crucial. Highlight the candidate gene against each GO term and point out the connected gene with threshold 0.05 to predict the unknown genes. Those subset files contain probe id with over 3000 was excluded as list function would die out.
For Cd11b, five GO terms belong to BP with number 0050798, 0045123, 0007229, 0007159 and 0030593; three GO terms belong to CC with number 0009986, 0009897, 0008305; six GO terms belong to MF with number 0001948, 0043395, 0008201, 0001846, 0046982 and 0004872. For Iba, only one GO term with 0005509 belongs to MF. For EAAT2 (Slc1a2), only one GO term with 0006835 belongs to BP. For p75, five GO terms belong to BP with 0008219, 0007166, 0006955, 0006954, and 0050728; two GO terms belong to CC with 0005624 and 0045121; two GO terms belong to MF with 0004872 and 0005031. For Isl1, ten GO terms belong to BP with 0031103, 0007507, 0003007, 0048762, 0007275, 0030182, 0032024, 0031290, 0021522 and 0021524; one GO terms belong to CC with 0005622; three GO terms belong to MF with 0003682, 0043565 and 0008270. For EAAT3 (Slc1a1), no GO terms are associated with any GO groups in rats.
Discussion
Graphical Gaussians Models
Graphical Gaussians Models (GGMs) are utilized to compute all partial correlations and consequently to build the corresponding network (for some specified threshold). In addition, GGMs are suitable for ‘small N, large P’ data sets because of introducing regularization and moderation. Partial correlations are a method and have been shown for construing regulatory interactions from observational data. However, GGMs could compute partial correlations with limited vector size (Wu et al. 2003), which returns an error of cannot allocate vector of size xxx Mb as the size is too large. My laptop returns an error with 5000 data but runs with 4000 data so as narrowing down the vector size is my priority task. Since the matrix rank is bounded by the sample size, the correlation matrix is normally degenerate.
The algorithm for calculating correlation coefficient of GGMs is Pearson correlation coefficient; different methods could result in different structure of gene networks. I can further discuss the diversity of creating network by different methods like Spearman.
Annotation files
NetAffx probe-to-gene annotations can be changed as the sequence data are updated with approximately 5% over a two year span (Perez-Iratxeta & Andrade 2005). Affymetrix probe sets are annotated based on the related current records in UniGene, which is a database of clusters of GenBank sequences. The inconsistence between versions of NetAffx annotation files can be detected when two probe sets attached to the same gene in one version of the annotations, while they attached to different gene names in another version. Take probe ID 1433436_s_at and 1419113_at of eight versions of NetAffx MOE430A/B annotation files for example (Table 2). NetAffx has been released 30 versions of MOE430A/B since 17th May 2003.

Using different versions of NetAffx annotation file could result in the variation in the biological interpretation of a microarray experiment. Besides, the entire mouse genomic sequence is not represented by experiment as there are around 17 percent of unassigned EST-only probe sets with mouse MOE430s annotation files till now.
Microarray raw data sets
As only two time points for mice data sets and one time point for rats data sets, the analyses for correlation may not as precise as data sets with more time points, which it will be an interesting challenge for time series extension. With longer time scale and dense of time points, the precision of estimating partial correlation structures would be higher, according to (Meyer et al. 2004). For additional time points, studying the gene relationships would be more interesting and accurate to reconstruct the time course studies by methods like vector autoregressive (VAR) models (Opgen-Rhein & Strimmer n.d.).
ALS mice and ALS rat
The data sets for this project are transgenic mice and transgenic rat. These species are inserted human SOD1 mutation into their own genetic material, thus developing them with a motor neuron disease. However, the analysis of using transgenic mice or rat is not as precisely as using human SOD1 data sets of the disease for some reasons: 1) not knowing the means of the treatment delays onset in mice to the human being. 2) for those genes that significantly identify in the network of mutant SOD1 rat are not exactly identified in mutant human SOD1 data sets. Nevertheless, it leads to a greater understanding of human ALS via the use of transgenic mice for testing new treatments and expanding our knowledge to understand the mechanisms of the disease based on my network results divided by GO term.
Future
Though I identify unknown genes correlated to candidate gene, no significant evidence can prove which unknown genes is crucially and may affect the ALS. More analysis methods need to be done to specific out the gene from whole unknown genes. Once the unknown genes have been theoretically identified, experimental evidence need to be setting.
Software
- R project version 2.11.0
- affy R package Version 1.26.1
- AffyCompatible R package version 1.8.0
- plotrix R package Version 2.9.3
- GeneNet R package version 1.2.4
- Gplots R package version 2.7.4
Abbreviations
- ALS amyotrophic lateral sclerosis
- SOD1 copper-zinc superoxide dismutase
- GO gene ontology
- VAR vector autoregressive
- FALS Familial Amyotrophic lateral sclerosis
- BP biological process
- CC cellular component
- MF molecular function
- EAAT excitatory amino acid transporters
Supervisor
- Prof Michael P H Stumpf
References
- Al-Chalabi A and Leigh PN. Recent advances in amyotrophic lateral sclerosis. Curr Opin Neurol. 2000 Aug;13(4):397-405. DOI:10.1097/00019052-200008000-00006 |
- Bolstad BM, Irizarry RA, Astrand M, and Speed TP. A comparison of normalization methods for high density oligonucleotide array data based on variance and bias. Bioinformatics. 2003 Jan 22;19(2):185-93. DOI:10.1093/bioinformatics/19.2.185 |
- Irizarry RA, Bolstad BM, Collin F, Cope LM, Hobbs B, and Speed TP. Summaries of Affymetrix GeneChip probe level data. Nucleic Acids Res. 2003 Feb 15;31(4):e15. DOI:10.1093/nar/gng015 |
- Lobsiger CS, Boillée S, and Cleveland DW. Toxicity from different SOD1 mutants dysregulates the complement system and the neuronal regenerative response in ALS motor neurons. Proc Natl Acad Sci U S A. 2007 May 1;104(18):7319-26. DOI:10.1073/pnas.0702230104 |
- Meyer RC, Törjék O, Becher M, and Altmann T. Heterosis of biomass production in Arabidopsis. Establishment during early development. Plant Physiol. 2004 Apr;134(4):1813-23. DOI:10.1104/pp.103.033001 |
- Opgen-Rhein R and Strimmer K. Learning causal networks from systems biology time course data: an effective model selection procedure for the vector autoregressive process. BMC Bioinformatics. 2007 May 3;8 Suppl 2(Suppl 2):S3. DOI:10.1186/1471-2105-8-S2-S3 |
- Perez-Iratxeta C and Andrade MA. Inconsistencies over time in 5% of NetAffx probe-to-gene annotations. BMC Bioinformatics. 2005 Jul 20;6:183. DOI:10.1186/1471-2105-6-183 |
- Pradat PF, Attarian S, Camdessanché JP, Carluer L, Cintas P, Corcia P, Echaniz-Laguna A, Gonzalez-Bermejo J, Guy N, Nicolas G, Perez T, Soriani MH, Vandenberghe N, Verschueren A, and coordination des centres de prise en charge des patients atteints de SLA. [Research in amyotrophic lateral sclerosis: what is new in 2009?]. Rev Neurol (Paris). 2010 Aug-Sep;166(8-9):683-98. DOI:10.1016/j.neurol.2010.03.006 |
- Rabin SJ, Kim JM, Baughn M, Libby RT, Kim YJ, Fan Y, Libby RT, La Spada A, Stone B, and Ravits J. Sporadic ALS has compartment-specific aberrant exon splicing and altered cell-matrix adhesion biology. Hum Mol Genet. 2010 Jan 15;19(2):313-28. DOI:10.1093/hmg/ddp498 |
- Rosen DR, Siddique T, Patterson D, Figlewicz DA, Sapp P, Hentati A, Donaldson D, Goto J, O'Regan JP, and Deng HX. Mutations in Cu/Zn superoxide dismutase gene are associated with familial amyotrophic lateral sclerosis. Nature. 1993 Mar 4;362(6415):59-62. DOI:10.1038/362059a0 |
- Schäfer J and Strimmer K. A shrinkage approach to large-scale covariance matrix estimation and implications for functional genomics. Stat Appl Genet Mol Biol. 2005;4:Article32. DOI:10.2202/1544-6115.1175 |
- Werhli AV, Grzegorczyk M, and Husmeier D. Comparative evaluation of reverse engineering gene regulatory networks with relevance networks, graphical gaussian models and bayesian networks. Bioinformatics. 2006 Oct 15;22(20):2523-31. DOI:10.1093/bioinformatics/btl391 |
- Al-Chalabi A and Leigh PN. Recent advances in amyotrophic lateral sclerosis. Curr Opin Neurol. 2000 Aug;13(4):397-405. DOI:10.1097/00019052-200008000-00006 |