Lidstrom:13C Incorporation Into Protein - Data Analysis
Back to Protocols
Our protocol
- Open the program: Start --> Programs --> MSD ChemStation --> Instrument #1 --> Instrument #1 Data Analysis
- Load the compound library from Z:\Common\Software\ChemStation Library/NIST08.L
- Load a sample file folder in navigator to the left. (right click)
- Chose an ion to look for
- Chose an amino acid, the use Yanfen's table to see the unique ion retention time and m/z.
- serine is a good 1st choice.
- after serine, look at ____.
- Chose an amino acid, the use Yanfen's table to see the unique ion retention time and m/z.
- Chromatogram --> extract ion chromatogram
- Enter time range that includes your expected retention time and a few minutes of buffer.
- Enter the m/z for the unique ion (use M-57)
- Make sure you have the right compound:
- double right click in the peak area. Double right click on the spectrum to match it to the library.
- Subtract background
- double right click on an area that is not the peak. Spectrum → subtract.
- Get Ion Intensities
- use right clicker to draw a rectangle with vertical edges at the ½ maximal height
- Spectrum → tabulate
- gives intensities for all ions in the time interval specified by your rectangle.
- Look for 13C shifts
- Example: If looking for Serine M-57, the mass of the unique ion should be 390.
- If you want to go back to full chromatogram, Chromatogram → Redraw TIC. (TIC = total ion chromatogram)
- You can chose which amino acid(s) to look at:
- serine is a good 1st check: comes from 3PG
- Alanine is a good 2nd to check: comes from pyruvate. (?? why not valine, leucine, or isoleucine??)
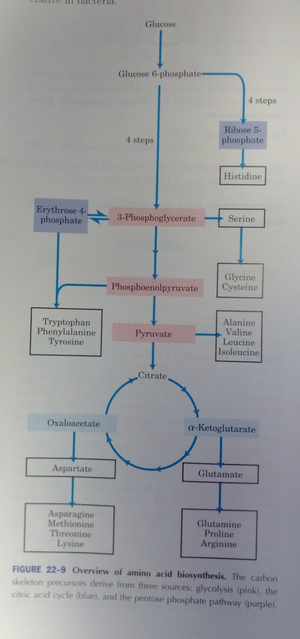
central metabolism: sources of amino acids - don't do methionine b/c formate can be unintentionally incorporated as formyl-methionine (for ATG codon)
- don't use the following: source: Accurate assessment of amino acid mass isotopomer distributions for metabolic flux analysis, 2007. (A paper Yanfen recommended)
- cysteine and tryptophan: can get oxidized during hydrolysis
- glutamine and asparagine: can be deamidated to glutamate and aspartate, respectively
- histidine derivative: less stable, may degrade.

Data Analysis from Martin
- Open Enhanced Data Analysis (ChemStation) from the desktop
- Mouse Actions
- Left button zoom, Double click with left resets view
- Right button action
Open File
- Open a file
- Or if your file is running, take a snapshot of the file and you can analyze that while the run is still going
Looking at your data
- To get an ion chromatogram for a peak: Draw Rt. button over part of the peak to get the ion chromatogram. Only the width of the box matters in terms of which ions will appear in the ion chromatogram
- To identify compounds in the ion chromatogram: Right button double click on the ion chromatogram to have Chemstation try to identify the compounds. This will turn up a list of possible matches. Need to go through each peak an look @ a list of possible candidates.
• ex) proline matches peak, but weird 283 peak ○ extract ion chromatogram for the different ions in the 283 and 253 peak --> can see to overlapping peaks • Best ion to look for is the M-57 --> shift by number of labelled carbons • select two areas, then go to spectrum --> subtract to do background substitution
- Go to spectrum tabulate to get a list of intensities. Copy ions to spreadsheet.
Data Analysis from Yanfen
Open Chemstation From menu--> chromatograms--> Extract ion chromatograms Use data from standard run (Yanfen said she'd send us Bo's data. This is a confirmation of the data from the table in the paper listing unique ions for each compound, std data does specify retention times) Put in time range and unique ions into form --> get mid point of peak at retention time to get average intensity (rt click drag box) --> of peaks in the ion chromatogram use the higher intensity peak usually the M-57. ex) for Ser use 390 not 432
Internal standard +4 all labeled C + 1 N labeled. --> normalized peak intensity to this
Look for N+3 --> 393 instead of 390.
Example Ser ion chromatogram 447 --> M-15 (loss of Ch4) 432 --> 390 M-57 highest abundance
Select peak --> go ion spectrum --> right double click
11/19 2:30pm --> 12am 11/20 Agilent 5975 GCMS
