IGEM:IMPERIAL/2009/M1/Modelling/Ezkinetics
Preliminary Model 2: Enzyme kinetics
Hypothesis
- The higher [E]0 is, the greater the activity measured from the assays.
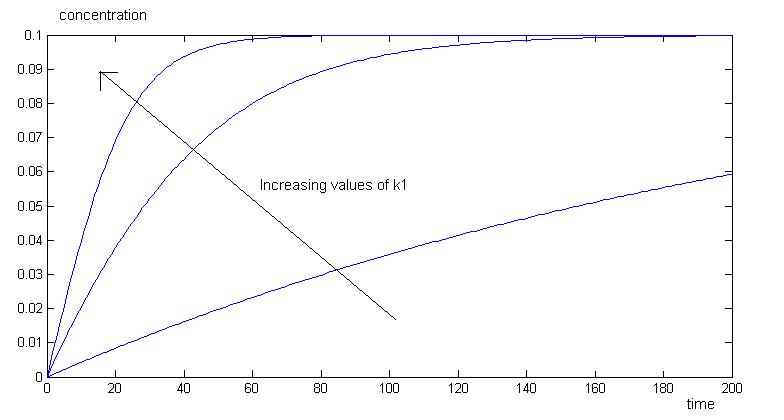
- k1 is related to the activity of the enzyme. Increasing values of k1 will increase [math]\displaystyle{ \begin{align} \frac{d{[}P{]}}{dt} \\ \end{align} }[/math].
Equations
Without Michaelis-Menten Assumptions
[math]\displaystyle{
\begin{alignat}{2}
\frac{d[E]}{dt} & = - k_{1}[E][S] + k_{3}[ES] + k_{2}[ES] \\
\frac{d[S]}{dt} & = k_{2}[ES] - k_{1}[E][S] \\
\frac{d[ES]}{dt} & = - k_{3}[ES] - k_{2}[ES] + k_{1}[E][S] \\
\frac{d[P]}{dt} & = k_{3}[ES]
\end{alignat}
}[/math]
With Michaelis-Menten Assumptions
[math]\displaystyle{ \begin{align} \frac{d{[}P{]}}{dt} &= v_0 = k_3 {[}ES{]} = \underbrace {k_3 {[}E{]}_0}_{v_\max}\frac{{[}S{]}}{K_M + {[}S{]}}\\ \end{align} }[/math]
where [math]\displaystyle{ K_M = \frac{k_{2} + k_3}{k_1}. }[/math]
Legend
insert table here =)
Explainations of equations
We want to know the amount of enzyme (PAH / Cellulase) produced. The purpose of this modelling is to relate substrate activity (which is what we measure from the assays) to the amount of enzyme produced via Michaelis Menten Kinetics.
[math]\displaystyle{
E + S \overset{k_1}\underset{k_{2}}{\begin{smallmatrix}\displaystyle\longrightarrow \\ \displaystyle\longleftarrow \end{smallmatrix}}
ES
\overset{k_3}
{\longrightarrow}
E + P \qquad \qquad
}[/math]
However, Michaelis Menten Kinetics is only applicable when [substrate] is >> [enzyme], such that all the active sites on the enzymes are taken up at any point in time.
Assumptions
1) [math]\displaystyle{ \begin{align} \frac{d{[}ES{]}}{dt} &= 0 \\ \end{align} }[/math]
2) Total [E] does not change with regards to time. [math]\displaystyle{ {[}E{]}_0 = {[}E{]} + {[}ES{]} \; \ = \; \text{const}. }[/math]
Hence, for this model to be applicable, we need a much higher concentration of PAH / Cellulase, as compared to the substrate phenylalanine and cellulose respectively.
We know from our assumptions and simplifications that
[math]\displaystyle{
\begin{align}
\frac{d{[}P{]}}{dt} &= v = k_3 {[}ES{]} = \underbrace {k_3 {[}E{]}_0}_{v_\max}\frac{{[}S{]}}{K_M + {[}S{]}}\\
\end{align}
}[/math]
We want to find out [E]0. KM can be found from literature, [S] is known, and activity is related to [math]\displaystyle{ \begin{align} \frac{d{[}P{]}}{dt} \\ \end{align} }[/math], hence, we can obtain vmax, and eventually [E]0.
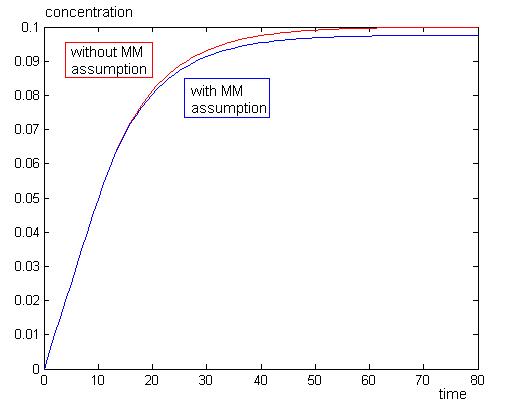
To check if the Michaelis-Menten assumptions apply to our model, we need to perform two simulations, one with the assumption, and one without. Then zoom in on the [ES] line. If it always remains at zero for our chosen parameters, then the assumption applies.
Simulations
Simulation 1: Analysing Michaelis-Menten assumptions
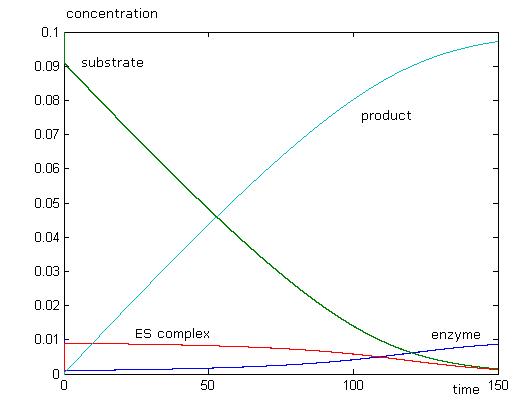
with a more zoomed in version
Explainations
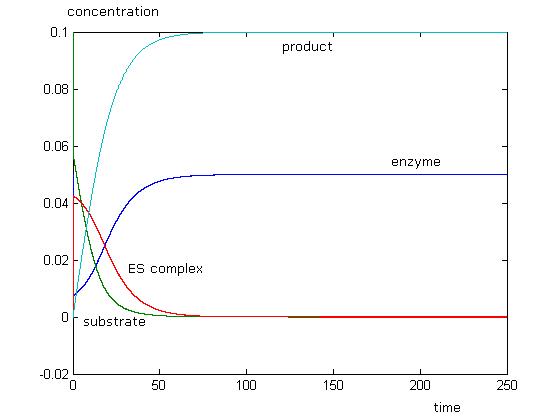
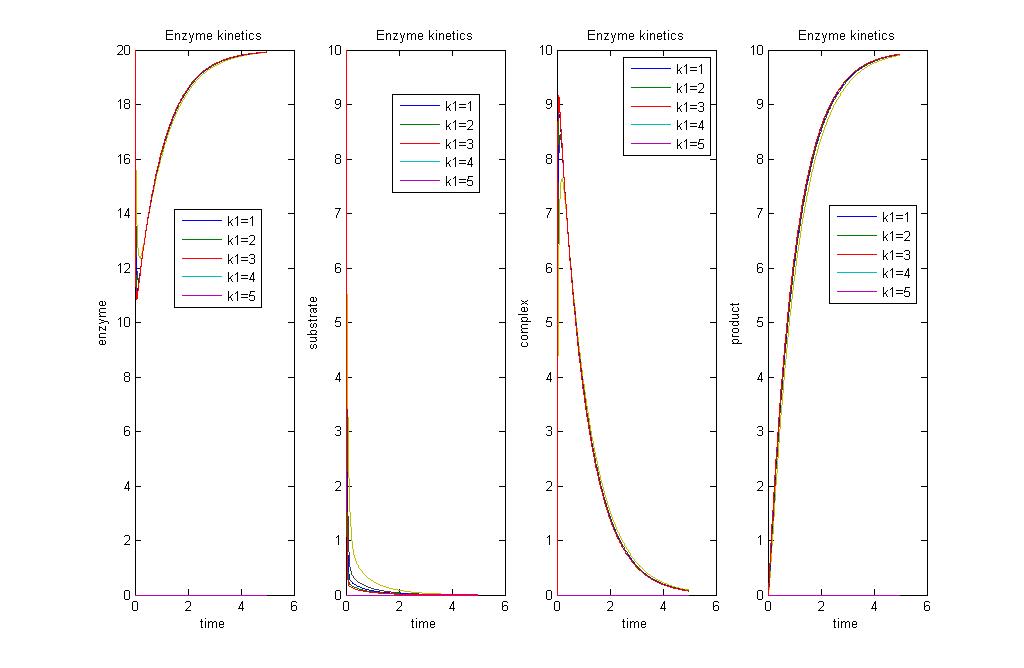
This simulation just shows that initially, enzyme and substrate concentrations will dip, and this is followed by a rise in product concentration. As all the substrate is used up, there will be no more product formed. Concentration of enzyme will return to initial values, while there will be no more substrate left. We can see that the Michaelis-Menten approximation does not apply with these parameters as [math]\displaystyle{ \begin{align} \frac{d{[}ES{]}}{dt} \\ \end{align} }[/math] is not equal to 0. When [math]\displaystyle{ \begin{align} \frac{d{[}ES{]}}{dt} = 0 \\ \end{align} }[/math], the reaction has already ended.
With the MM assumption, we would expect product to be formed faster. When k2 is much smaller than k1 in orders of magnitude, MM assumption does not apply very well to the system. When k2 values are approaching k1, in orders of magnitude, MM assumption will apply well to the system.
Simulation 2:Varying rates of enzymatic activity k1
Explainations
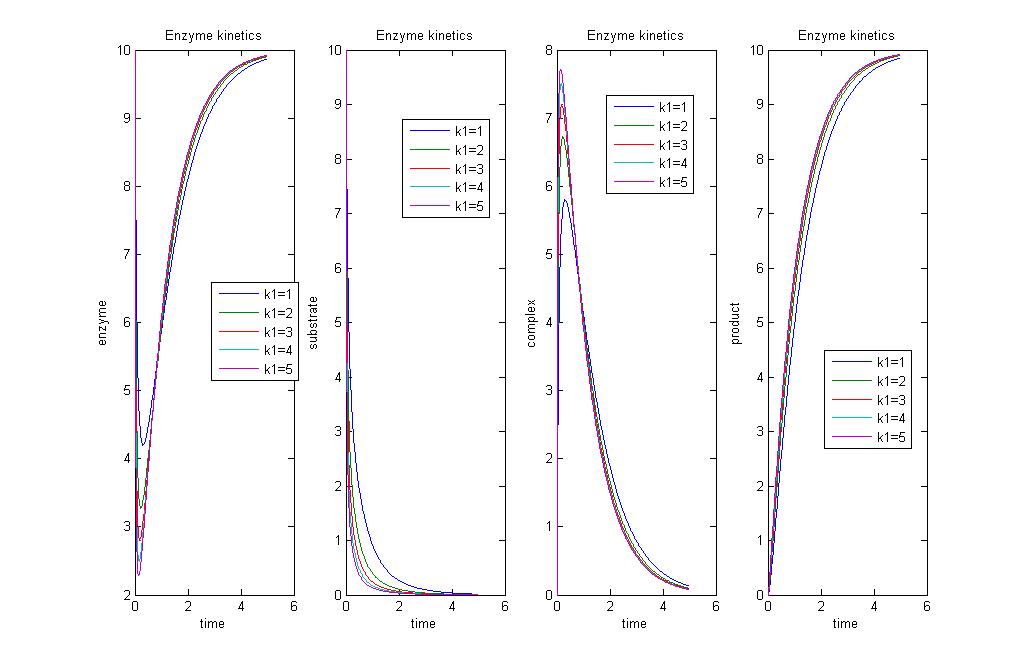
As we vary the values of k1 in orders of magnitude, we have varying rates of product production. As k1 increases, we have a faster production of product.
Explainations
The above graph shows the concentrations of enzyme, product, substrate and ES complex, with increasing k1 values. Increasing k1 will increase rate of production of product, ES complex, and increases rate of consumption of enzyme and substrate.
Simulation 3: Varying [E]0
Explainations
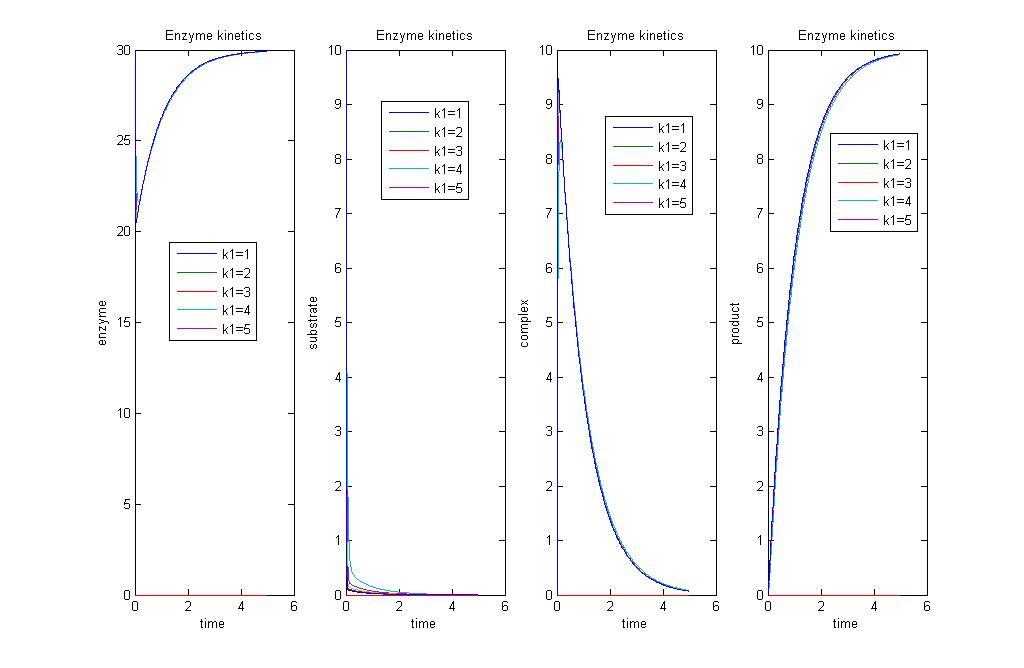
When there's a greater initial concentration of enzyme [E]0, there's greater rate of production of product, hence greater activity.
