IGEM:IMPERIAL/2007/Projects/Hrp System/Testing/Fluorescence
From OpenWetWare
Jump to navigationJump to search
The Fluorescence of each well are measured and then using this calibration curve are converted into molecules of GFP synthsised per second. This is to convert the units into units representing protein synthesis per second.
Calibration Curve Principles
There are three calibration curves needed to allow the raw data to be converted into molecules of GFP synthesised.
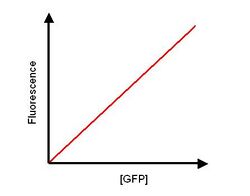
1. Calibration Curve

- A known concentration of GFP is diluted into a range of dilutions. The dilutions are carried out in cell lysis of the wild type of the host cells used, e.g. if K12 used as expression cell, then a lystae of K12 cells are used.
- The fluorescence of these dilutions is measured and plotted against concentration of GFP.
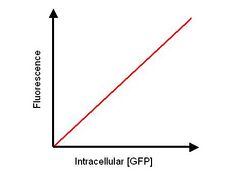
2. Calibration Curve

- An E.coli culture with relevant vector is grown and GFP induced using a concentration of inducer to give a high expression. At various time points the absorption and fluorescence is measured of the cells. The varying time points will mean that fluorescence will be being measured at various intracellular concentrations of GFP.
- After absorbance and fluorescence is measured then the cells are lysed and the 3. Calibration curve is plotted.
- Using the data a calibration of fluorescence before lysis is plotted.
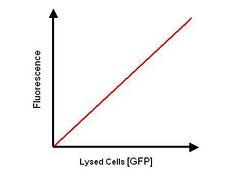
3. Calibration Curve

- The cells cultures from 2. calibration curve are lysed and the fluorescence measured, a graph can then be plotted of fluorescence after lysis.
Data Analysis
- With the three calibration curves shown above the raw data of fluorescence of a well can be converted into the GFP molecules synthesised per second.
- By comparing Graph .1. with Graph .3. you get the relationship between the concentration of GFP and the fluorescence.
- By comparing Graph .2. and Graph .3. you get the relationship between the fluorescence in lysed cells and the fluorescence within a cell.