IGEM:IMPERIAL/2007/Projects/Hrp System/Data analysis
Data Analysis
The raw data from the two test constructs is absorbance and fluorescence at varying time intervals. We want to convert this raw data into rate of GFP synthesis per cell. To carry out this conversion the Calibration Curves are used. For each concentration of inducer the absorbance into colony forming units (cfu) and fluorescence into the rate of GFP molecules synthesised sec-1. The final units are GFP molecules synthesised cfu -1 sec-1 .
Test Construct Promoter
The data collected will the absorbance and fluorescence measured of a series of cultures exposed to different concentrations of inducer. The data collected for each culture can be displayed in:
- Fluorescence vs Time
- Absorbance vs Time
Then using the calibration curve these two graphs can be converted into:
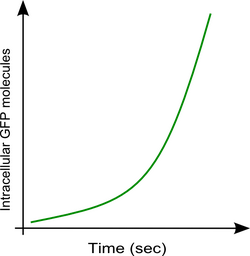
Intracellular [GFP] molecules vs Time
 |
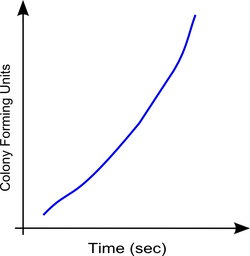
Colony Forming Units vs Time
 |
From these two graphs the following information can be derived:
The rate of GFP molecules synthesised sec-1 from measuring the gradient of the 'Intracellular [GFP] molecules vs Time' for a particular time point.

The GFP molecules synthesised sec-1 can then be converted into the final units by dividing by the CFU, this will give the final units of GFP molecules synthesised cfu -1 sec-1.

The final result will be:
'GFP molecules synthesised cfu -1 sec-1 vs Time' for a series of inducer concentrations.
These concentrations can be displayed relative to each other on a 3D graph:
'GFP molecules synthesised cfu -1 sec-1 vs Inducer Concentration vs time'
<plot> set contour base set nokey set title "3D gnuplot example" set xlabel 'TIME' set zlabel 'GFP molecules synthesised per sec per CFU' set ylabel 'Inducer Concentration' splot [-12:12.01] [-12:12.01] sin(sqrt(x**2+y**2)) / sqrt(x**2+y**2) </plot>
Test Construct Device
The data collected for this test construct will be the same as that for the first test construct, the difference being in that in this test construct we are measuring the output of GFP molecules synthesised cfu -1 sec-1 from our device. The same conversions described for 'test construct promoter' are applied. The result will be: 'GFP molecules synthesised cfu -1 sec-1 vs Time' for a series of inducer concentrations. These concentrations can be displayed relative to each other on a 3D graph: 'GFP molecules synthesised cfu -1 sec-1 vs Inducer Concentration vs time'
Combining Data
The data collected from each construct can be combined to give us the expected inputs and outputs of our device. This is because:
- Test Construct Promoter experiments measured theGFP molecules synthesised cfu -1 sec-1 into our device.
- Test Construct Device measured the GFP molecules synthesised cfu -1 sec-1 output in response to the various inputs.
The data can be combined so that a 3D graph can be plotted of: 'GFP molecules synthesised IN vs GFP molecules synthesised OUT vs time'
Click here for diagram on the principles of the calibration curve