IGEM:Harvard/2006/Adaptamers/Notebook/2006-8-26
8/26
Strand Displacement
We'll test if strand displacement can quench the adaptamers.
- Abbreviations/Syntax
SMB: Streptavidin Magnetic Beads BB: Bittker Buffer SS: standard setup r A B: replace A in SS with B.
- Conditions
1. Standard setup: 40 pmol A20 + 100uL .4% solids SMB + 160 pmol thrombin
2. =1
3. +10 pmol A20.20
4. + 20 pmol A20.20
5. + 40 pmol A20.20
6. + 10 pmol A20.35
7. + 20 pmol A20.35
8. + 40 pmol A20.35
9. r A20 A50
10. r A20 T20
11. r A20 S20
12. r thrombin nothing
- Methods
100 uL SMB --> 10 uL + 40pmol (1-8, 12. A20 9. A50 10. T20 11. S20 12. A20) + (1-11. 160 pmol thrombin) --> 15 uL -->30 minute shake --> + (3. 10 pmol A20.20 4. 20 pmol A20.20 5. 40 pmol A20.20 6. 10 pmol A20.35 7. 20 pmol A20.35 8. 40 pmol A20.35) --> 19 uL --> shake 20 minutes --> 2X wash --> + 4 uL .200 ug/uL anti-thrombin primary Ab --> 2X wash --> + 1 ug/uL seconday Ab --> 3X wash --> 50 uL --> imaging on 96 well plate.
- Results
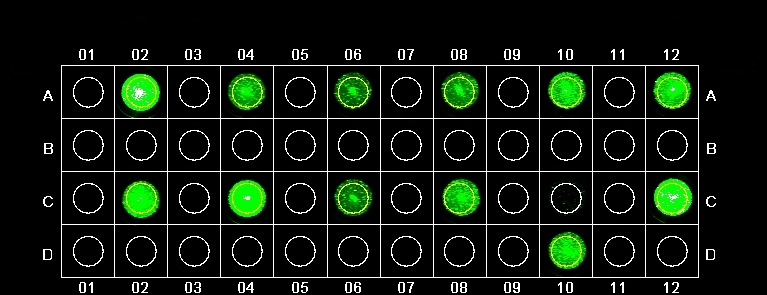
A2. Standard setup: 40 pmol A20 + 100uL .4% solids SMB + 160 pmol thrombin. Intensity = 15776.12.
A4. =1. Intensity = 1476.3.
A6. r A20 A50. Intensity = 952.49.
A8. +10 pmol A20.20. Intensity = 1215.66.
A10. + 20 pmol A20.20. Intensity = 2292.83.
A12. + 40 pmol A20.20. Intensity = 3611.68.
C2. + 10 pmol A20.35. Intensity = 2419.15.
C4. + 20 pmol A20.35. Intensity = 5133.35.
C6. + 40 pmol A20.35. Intensity = 988.82.
C8. r A20 T20. Intensity = 1483.64.
D10. r A20 S20. Intensity = 10617.96.
C12. r thrombin nothing. Intensity = 1889.81.
These results were completely loopy. The positive controls in A4 had a very low intensity; the negative control in D10 had a very high intensity. It is possible that samples were mixed up. Addition of displacement strands resulted in relatively low fluorescence; however addition of more displacement strand tended to increase intensity (A8-A12, C2-C6). All in all puzzling data; the experiment must be run again.
ELISA
We'll attempt to quantify how much thrombin is bound by the adaptamers using an ELISA
