HypocoTool
HypocoTool
Introduction

HypocoTool is an image analysis tool that enables the automatic measurement of stems (hypocotyls) and roots of the model plant Arabidopsis Thaliana. It alleviates the need for laborious and repetitive manual measurements and allows objective, reproducible and property rich data extraction.
The tool was written by Ron Milo in collaboration with members of Christine Queitsch's lab. HypocoTool works under the Matlab programming environment. It is publicly available, you can see examples, instructions and download the code through this webpage.
Motivation
Quantifying phenotypes is at the heart of many experiments in plants genetics. High throughput experiments require automation in as many steps as possible to decrease manual labor. Hypocotyl and root length of seedlings are some of the most widely used phenotypes to characterize plant responses to environmental stimuli, such as light, hormones and gravity. Furthermore, they are a well defined and precisely measurable property suitable for qualitative genetics approaches. In many current experiments a batch of 100-1000 plates with about 10 seedlings each are common. These plates are usually photographed, and then measured manually by tracing the length of the hypocotyl and root. This often requires over a week of repetitive work from several researchers to analyze.
HypocoTool is a semi-automatic tool based on image analysis that quantifies lengths using markers rapidly made at the time of acquiring the image of the plate. We analyzed the accuracy of this tool in respect to manual measurements and find that it saves over three quarters of the time originally invested. Moreover, the results show superior accuracy and repeatability as well as the ability to quantify more advanced characteristics of roots and hypocotyls such as curliness, symmetry etc.
Overview of workflow
- Plant seeds in petri dish and grow for ~10 days
- Mark stem/root interface with a marker (and optionally hypocotyl and root tip)
- Take an image of plate
- Run HypocoTool on images
- Quality check results
Detailed description
Markings
- The software requires the manual marking of the root/hypocotyl interface and optionally the tip of the hypocotyl and root.
- Markings should be made with fine tip markers, we recommend using green color.
- Other markings made on the plate such as numbering of the plate and seedlings, location for the seed etc should preferably be done with a different color of marker, we suggest black or red.
Acquiring images and file names conventions

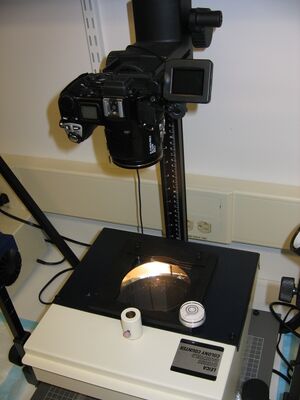
- Plates are put on a dark field illuminator (Leica Quebec Darkfield Colony Counter, available from Fisher catalog number 13332500) which shines light from below (see image of setup)
- Images are captured with a digital camera and are later transfered to the computer.
- It is best to have the camera stably mounted at a fixed distance from the plates. (add image of setup)
- Repeatability can be facilitated by keeping the camera location constant. Also it is best to have the zoom either at maximal or minimal zoom level to enable repeatability between different days.
- For simplicity we currently require the images file name to be in the following format: 4 letters of your choice, followed by a 4 digit image number, and then .tif.
- Examples of valid names: DSCN4593.tif, temp0001.tif.
- Examples of invalid names: image1.jpg (two many characters before number, two few digits in image number, wrong file type name.
- The code was developed working with tif files at a resolution of 600 by 800 pixels.
Running HypocoTool
- First download the relevant Matlab files below, put all source codes and images in the same directory.
- Launch Matlab, go to the directory where files were saved
- Calibrate HypocoTool to by running calibrateHypocoTool (see detailed instructions below)
- The main code to run is batchMeasureHypo7
- You will be prompted to choose the first and last images to analyze
- HypocoTool will measure all images between the first and the last
Calibrating HypocoTool
- In order for HypocoTool to know the benchmark for sizes one needs to take an image of a blank plate (catalog number XXX) with grid markings at the same magnification and distance used for the other images
- To perform the calibration run: calibrationHypoTool
- The software will prompt you to choose to adjacent grid point (which in a standard plate are 13mm apart
- You do it twice, one for an image taken in the beginning of the exp and one in the end.
- The software will automatically extract the calibration ratio and apply it to all further measurements
- Be sure to repeat this process every time you run a new batch of plates with new settings
Helping to choose optimal segmentation thresholds in HypocoTool
- HypocoTool detection of roots and stems is based on automatically segmenting the image using predefined thresholds. You can choose to use the built in or previously saved thresholds or to help set them yourself.
- Setting thresholds manually is easy. When asked "Use built-in/saved thresholds or choose manually?" choose manual, and you will then only need to indicate which of a set of images has the best level of detection and that will choose the segmentation values and will proceed to analyze your images. Notice that it will take about 5-10 minutes to form the images for you to choose from and thus you probably do not want to do it more than once or twice per experiment.
- Advanced users can choose to change the thresholds directly in the code.
Output format
The output of HypocoTool are:
- A file of type .bmp for each image that shows the original image with the detected objects and their lengths superimposed.
- A text file containing all the lengths measured per image.
Lengths are by default given in millimeters. Output text file for hypocotyls lengths would have the following name format (denoting what images were analyzed): lengthsReportHypo4965-4967.txt Output text file for root lengths would have the following name format (denoting what images were analyzed): lengthsReportRoots4965-4967.txt In each such output file the name of the image is displayed followed by the measurements taken.
Quality assurance
Visual inspection of the resulting tiff images that show the measurements on top of the original image enables one to validate the accuracy or inaccuracy of the measurement and to correlate the values saved in the text file to the different seedlings on the plate. It is useful to copy the values from the text file to an excel type of spreadsheet and there to relate the values to the experiment design. Some percentage of seedlings (usually around 20%) will not be measured accurately automatically, and depending on the application could either be measured manually or discarded from the analysis.
Estimated success rate and time investment/savings
The success rate in correctly identifying and measuring the lengths of hypocotyls and roots are about:
- 70%-90% success rate for hypocotyls
- 60%-80% success rate for roots
Here is a crude estimate of time considerations, clearly these vary on the person, approach and aim
- Marking and acquiring images of 100 plates (approximately 1000 seedlings) takes about 4 hours
- Running the code should take about half an hour (and then about a minute or two per plate of the computer time)
- Quality assurance for 100 plates should take about 4-6 hours
- This could be compared to the time taken to manually measure lengths which is about 2 working days
Some advantages to remember:
- Results are objective, often more accurate and repeatable
- Method is easily scalable to any number of plates
- Save laborious and exasperating work time
Examples
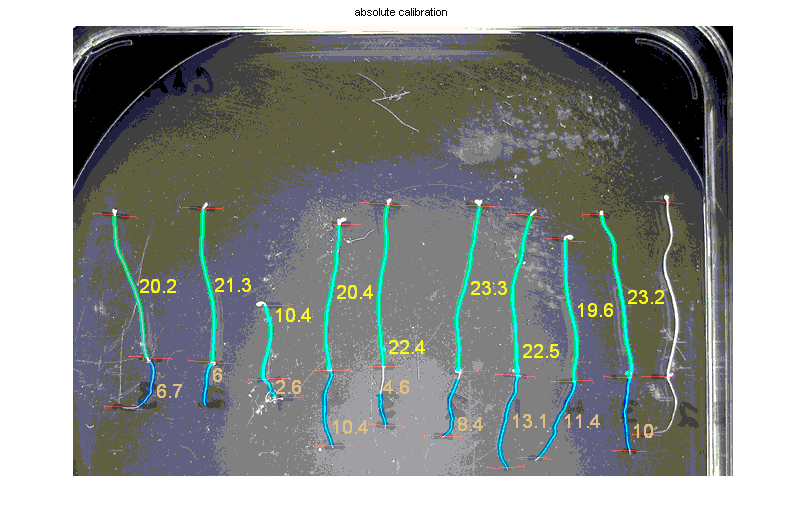
- An example of the automatic measurement of hypocotyls and roots. Light green are hypocotyls, blue are roots. Lengths are indicated in yellow and appear in an output text file. Notice that root 5th from the left was only partially segmented and should be ignored, and that the seedling in the far right was not analyzed.
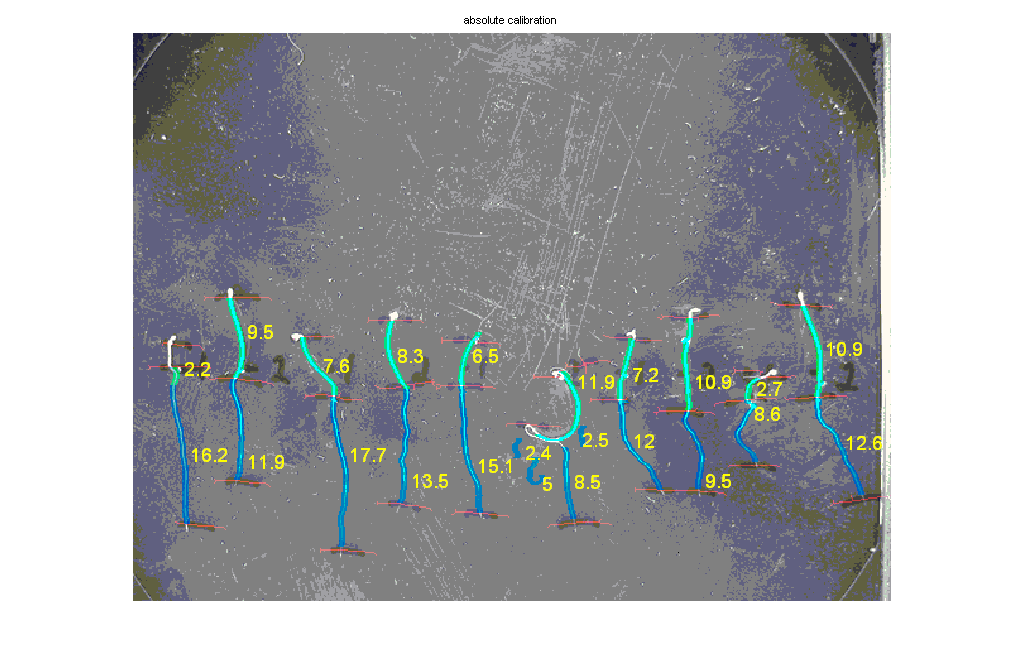
- An example of the automatic measurement of hypocotyls and roots. Light green are hypocotyls, blue are roots. Notice that seedling 6th from the left was not measured correctly because of irregular shape. It is recommended that in these cases the seedling would be aligned before measurement or the measurement be done manually. The hypocotyl of the seedling on the far left was incorrectly segmented and should be ignored.
How it works?
HypocoTool proceeds in several stages in order to measure lengths:
- A combination of thresholds and morphological operations are used in order to segment the image, i .e. automatically detect the hypocotyls and roots. The operations are based on characteristics of how roots and stems look in images, their contrast with the background, their width, height and location etc.
- The resulting segments lengths are estimated.
- The values are written to an output file and an output image is produced.
- All operations are done under the Matlab environment. You need to have a working version of Matlab with the image processing toolbox installed on your computer. This software is widely available in most research institutions.
Troubleshooting
Like any respectful code there could be several things that can go wrong
- An error message "no files selected" often means that the program is trying to load an image that does not exist. Most common cause is that the sequence of images chosen (between first and last image) misses one or more intermediate images.
- The program crashes when analyzing a specific image. This can happen because of some special combination of pixel locations that defies the software logic. We try to make this rare but if it happens recurrently, you may need to analyze this plate manually.
- In all cases of early termination of a sequence of images, the intermediate results are still saved in the output files and you therefore do not need to reanalyze them. You can continue running the program, choosing as a starting image the one after the problematic image.
Download code
- All the required Matlab codes are within the zip file below.
- See details on which codes to run above in the detailed description section
HypocoTool source codes: File:HypocoTool22Aug07.zip

