Graphing L-Curves in R
This page details a method for graphing and labelling L-curves based on optimization outputs generated using GRNmap. The script and steps necessary to do so are found below.
Tutorial
Formatting the Data for R
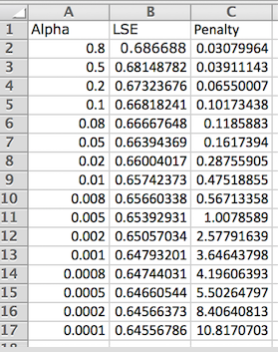
In a new Excel sheet, create 3 columns: Alpha, LSE, & Penalty (capitalization matters; order does not). Fill these columns with the data generated from the L-curve analysis in GRNmap. A sample of what this looks like is found below:

- Note: Although it is possible to have other data in this sheet, missing values will trigger an error in R.
In order to import this data into R, it is easiest so save the Excel sheet as a Tab-Delimited Text file (.txt).
Running the Script
The interactive script to graph and label L-curves based on GRNmap optimization outputs can be downloaded from this GitHub page. To do so, right-click on the "Raw" button above the code and select "Download Linked File As..." to save this script as a text file. To use the downloaded script, follow these steps:
- Type the following into the R command line and press enter:
source("pathway to script .txt file")
- This will trigger the prompt "Provide a Pathway to the Dataset:". In the command line, type in the pathway to the .txt file containing the L-curve data and press enter.
- A second prompt asking from a title for the graph will be triggered. Simply type in the title to be displayed at the top of the L-curve and press enter.
- R will output a labelled L-curve generated from the inputted data. This graph can be saved manually.
Samples
The following graphs from the L-curve analyses for dGLN3 were plotted and annotated in R using this method: