File:Recirculation Example.png
Original file (1,244 × 579 pixels, file size: 477 KB, MIME type: image/png)
Summary
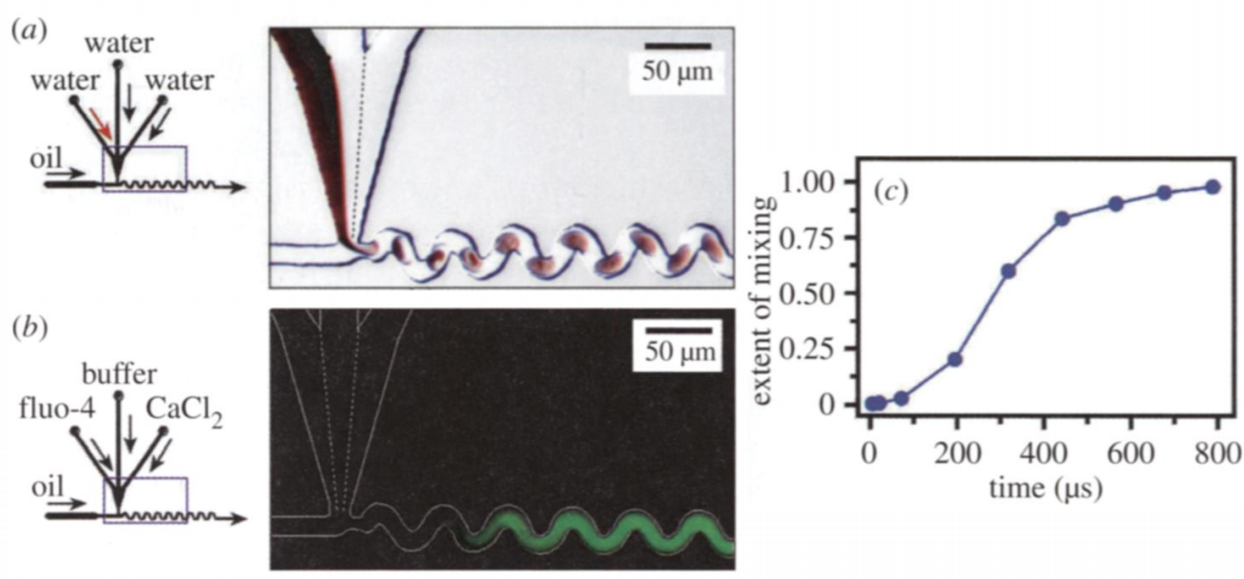
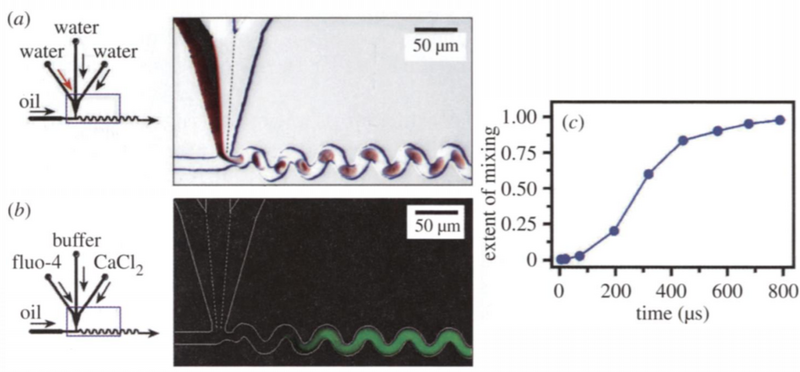
Inducing mixing by chaotic advection in plugs moving through microfluidic channels and quantifying this mixing by measuring fluorescence. (a) Left: schematic of the microfluidic network. Right: microphotograph (10 gs exposure) illustrating mixing. The solutions used were as in figure 1. (b) Left: schematic of the microfluidic network. Right: false-colour fluorescence microphotograph (2 s exposure, shows time-averaged intensity where individual plugs are not visible). The white lines trace the walls of the microchannel. The dashed white lines indicate the laminar flow of reagents in the junction of the aqueous inlet channels. Aqueous streams were solutions of 54 gM fluo-4, 70 jM CaCl2 (both in 20 mM sodium morpholine propanesulfonate buffer (MOPS), pH 7.2) and 20 mM buffer. The oil stream was as in figure la. (c) A mixing profile obtained by analysing fluorescent images from a microchannel with smaller cross-sectional dimension 10 um x 10 um
File history
Click on a date/time to view the file as it appeared at that time.
| Date/Time | Thumbnail | Dimensions | User | Comment | |
|---|---|---|---|---|---|
| current | 22:03, 19 April 2020 | | 1,244 × 579 (477 KB) | Samarsden (talk | contribs) | Comparing mixing in flow cavities and in plugs moving through microchannels. Mixing by (a) steady, recirculating flow and (b) chaotic advection. (i) Mixing represented by schemes of flow in a flow cavity; (ii) images of flow in a flow cavity (reproduced with permission of Cambridge University Press from Ottino (1989)); and (iii) schemes of flow in plugs moving through (a) a straight and (b) a winding channel (Bringer, 2004) |
You cannot overwrite this file.
File usage
The following page uses this file:
