FACS - Josh Hall
Introduction
Fluorescence-assisted cell sorting utilizes the process of flow cytometry. Flow cytometry is used to analyze multiple parameters between cells in heterogenous population such as size, granularity, and fluorescence1. Flow cytometry is performed by passing millions of cells individually through a laser beam at the interrogation point, capturing the diffracted light as they pass. The data gathered from this can be analyzed statistically to report overall characteristics of a cell population. Flow cytometry has many applications in various areas of biology. A common use for flow cytometry is to measure the level of CD4+ vs CD8+ lymphocytes in an HIV positive patient to determine if he or she has AIDS.
Flow Cytometry

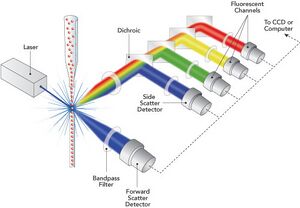
The basic components of a flow cytometer are a fluidics system, lasers, optics, detectors, and electronics and computer system1. The fluidics system uses hydrodynamic focusing to direct cells in a saline solution through an increasingly narrow cylindrical chamber. The channel becomes so narrow that cells may only pass one at a time through the interrogation point. Typically, cells between 1-15μm in diameter can be used2. The lasers are located at the interrogation point and are the source of light for scatter and fluorescence. As the laser passes over the cell, it will diffract or scatter light in all angles. The magnitude of forward scatter is generally proportional to the size of the cell. The optics then gather and direct the light to the detectors. The detector then converts the light intensity into voltage. The resulting signals are then converted into digital data is then stored by the electronics and computer system. However, forward scatter is only capable of giving a one dimensional view of cellular analysis. Side scatter is also directed through a separate lens system and analyzed through a different detector. Forward scatter is directly proportional to cell size, while side scatter is proportional to cell granularity. These two characteristics allow cell types to be distinguished. The information from forward and side scatter can then be combined to produce a two dimensional plot. Once a cell type has been characterized, a set parameters known as a gate can be set based on its common characteristics. In this case, a cell's type can be determined based on its forward and side scatter readings, so it can be sorted into its appropriate container and the number of each cell type can be quantified. However, a gate can be set based on any quantifiable characteristic of the cell, and certain cell types are too similar to accurately differentiate on forward and side scatter.
Fluorescence Labeling

Flow cytometry also can utilize fluorescent labeling to differentiate cells. This is applied when two cell groups have physical characteristics that are too similar to be differentiated based on scatter alone. Fluorescent labeling involves a fluorophore that specifically binds to a target biomolecule via an antibody, protein, or amino acids. 4. First a fluorescent tag is applied to a cell sample which binds to a specific membrane protein on the target cell type. When this cell enters the interrogation channel, laser light of a certain wavelength is emitted through the fluorescent molecule, which causes a longer wavelength light to be emitted and detected by the flow cytometer4. The fluorescent light travels along the same path as the side scatter signal, however there is a series of filters and mirrors that direct each wavelength of light to a distinct detector.
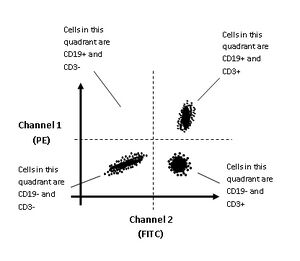
Generally, two differently labeled antibodies are used that emit distinct wavelengths from the same excitation wavelength. The most commonly used dyes are green and orange. This allows the flow cytometer to collect data regarding the fluorescence wavelength and intensity of each cell. This data is reflected in a two color dot plot that depicts how many cells fall into each general population: cells with high green fluorescence, cells with high orange fluorescence, cells with both bright green and bright orange fluorescence, and cells with low green and low orange fluorescence. A gate can be set based on the fluorescent character of each cell type to improve sorting.
Fluorescence-Activated Cell Sorting

Fluorescence-activated cell sorting (FACS) utilizes fluorescence cytometry to sort a heterogenous mixture of cells into two or more distinct groups3,5. The cell population is suspended and flows through a narrow and rapidly flowing stream of liquid. The cells individually pass through the interrogation point where their fluorescent and scattering characteristics are measured. A vibrating mechanism is applied to the stream that separates the liquid into individual droplets. It is very unlikely that a droplet will contain more than a single cell. An electrical charging ring is positioned immediately downstream of the vibration mechanism that produces a charge depending on the fluorescent and scatter characteristics detected. This applies an opposite charge on each individual droplet5. Further downstream is an electrostatic deflection system which directs each droplet into containers based on their charge. Thus, the cell droplets are separated based on their positive or negative charge.
References
[1] Julius MH, Masuda T, Herzenberg LA (1972). Proc. Natl. Acad. Sci. U.S.A. 69 (7): 1934–8. doi:10.1073/pnas.69.7.1934. PMC 426835Freely accessible. PMID 4114858.
[[2]] Tung JW, Heydari K, Tirouvanziam R, et al. Modern Flow Cytometry: A Practical Approach. Clinics in laboratory medicine. 2007;27(3):453-v. doi:10.1016/j.cll.2007.05.001.
[3]M. Y. Hoven, L. De Leij, J. F. Keij, T. H. The J Immunol Methods. 1989 Feb 24; 117(2): 275–284.
[4]Doucett VP, Gerhard W, Owler K, Curry D, Brown L, Baumgarth N (2005) Enumeration and characterization of virus-specific B cells by multicolor flow cytometry. J Immunol Methods 303: 40–52. S0022-1759(05)00188-2 [pii]; doi:
[5]Ibrahim SF, van den Engh G. Flow cytometry and cell sorting. Adv Biochem Eng Biotechnol. 2007;106:19–39.
