Endy:Victor3 Absorbance and fluorescence backgrounds
| Sample | Absorbance | GFP-Separated |
|---|---|---|
| Empty well | 0.032 | 941 |
| Water | 0.042 | 924 |
| EZ media + 0.4% Glycerol | 0.038 | 1035 |
| EZ media + 0.4% Glycerol + Amp | 0.04 | 1003 |
| EZ media + 0.4% Glycerol + Tet | 0.047 | 943 |
| EZ media + 0.4% Glycerol + Amp + Tet | 0.048 | 978 |
| EZ media + 0.4% Glucose + Amp + Tet | 0.047 | 1708 |
| EZ media + 0.4% Glycerol + Kan | 0.046 | 833 |
| EZ media + 0.4% Glycerol + Strep | 0.055 | 738 |

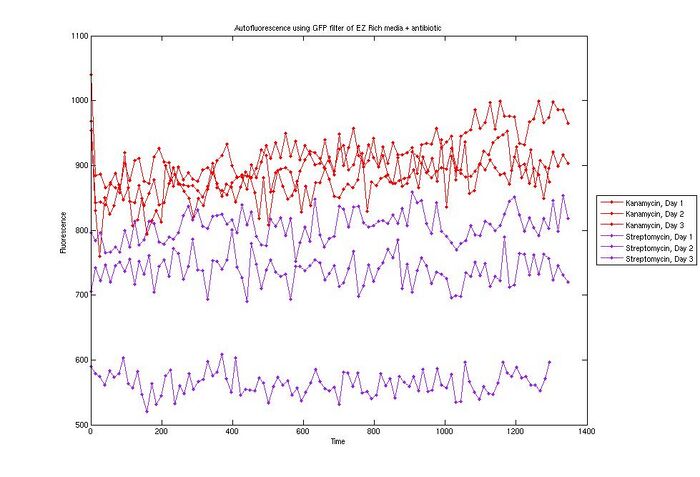
This plot shows the background fluorescence of EZ rich media from Teknova + 0.4% glycerol + antibiotic over time. This is data from two separate runs done on different days (circles and squares). Each run is an average of 3 replicates.
This experiment was done on the Endy lab Victor3 plate reader using 96 well plates from the Endy lab but using media and antibiotic from the Knight Lab. Water was injected into the wells over the course of the experiment to counteract evaporation, according to this protocol.
The reason for the lower background of EZ rich media + streptomycin for one of the days is unknown.
This plot is intended to demonstrate fluctuation in background (media-only) fluorescence measurements over time. This data is very preliminary and has not been independently verified. Use at your own risk!

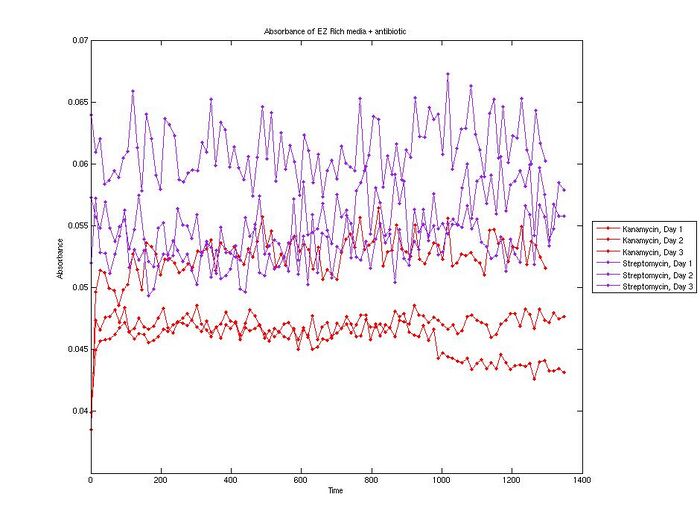
This plot shows the background absorbance of EZ rich media from Teknova + 0.4% glycerol + antibiotic over time. This is data from two separate runs done on different days (circles and squares). Each run is an average of 3 replicates.
This experiment was done on the Endy lab Victor3 plate reader using 96 well plates from the Endy lab but using media and antibiotic from the Knight Lab. Water was injected into the wells over the course of the experiment to counteract evaporation, according to this protocol.
This plot is intended to demonstrate fluctuation in background (media-only) absorbance measurements over time. This data is very preliminary and has not been independently verified. Use at your own risk!