Endy:F2620/Transfer Curve/Data
From OpenWetWare
Jump to navigationJump to search


- Transfer curve raw data part 1 (.xls) - absorbances starting around 0.08
- Transfer curve raw data part 2 (.xls)
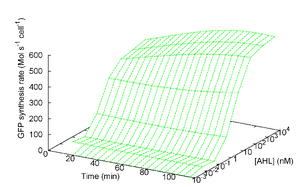
- Processed transfer curve data for 8 colonies (.xls)
- Processed transfer curve data for 8 colonies-points only (.tvs)
- |Processed master curve data -points only (.tvs)