Endy:F2620/Stability/Data
-
FACS stability plot
-
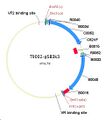
Image taken from T9002-pSB3k3.gb
-
Schematic of T9002 and the T9002 mutant. Solid black arrows indicate the two 143bp homologous regions in T9002.
-
Growth curves for T9002 and the mutant T9002.
- Stability Plate Reader Data (.xls)
- Stability FACS Data (.xls)
- Sequence files for day 1+, 5+, and 5- (raw data)
- T9002 and T9002m growth curves (.xls)
- Genbank file of T9002 in pSB3k3. Annotation includes BioBrick parts, and sequencing primer binding sites.
Growth rate differences
From the data above, we calculated doubling times of 59mins and 53.8mins for the induced T9002 and T9002mutant cells. Using an exponential growth model, it would take 30hrs to go from an equal number of correct and mutant constructs to a 95% population of T9002mutants.
Source of the recombination mutant
Homologous region of T9002-pSB3k3 - 883-1025=1830-1972 (143bp)

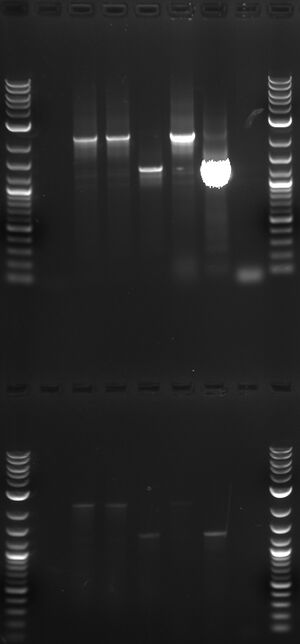
Lane 1 - prep of T9002 purified to be full length.
Lane 2 - prep from day 1+(1)
Lane 3 - prep from day 1+(2)
Lane 4 - T9002 from Day 5+
Lane 5 - single-colony PCR from streak of T9002 glycerol
Lane 6 - single-colony PCR from streak of T9002 day 5+ glycerol
Lane 7 - no template control
Multiple replicates of the stability experiment suggested that the recombination mutant always takes over the culture after the same number of doublings. This is non-intuitive if the mutation is random and can occur at any time. The most likely explanation is that the mutation is pre-existing in the long-term stock of T9002 (the receivier-reporter composite part). However since the experiment was repeated multiple times, from a different single colony from a different streaked plate each time, the pre-existing mutant would have to be in every cell even though those cells also seem to contain the correct sequence for T9002 (since the strain was sequenced verified and functions as expected for ~70 doublings). This would suggest that a small fraction of the plasmids in each cell contained the mutant T9002 rather than the correct sequence.
To this theory TK suggested we do a PCR using an elgonation time optimized for the mutant T9002 which is shorter than the correct T9002 sequence (1314bp vs. 2261bp PCR product). We carried out this PCR as suggested, using two different elongation times (one intended to amplify the correct T9002 sequence, one to amplify the mutant T9002). The results of the gel are shown on the right. It would appear that even at the longer elongation time, the mutant T9002 is visible. The most important lane to examine is lane 5 on the top or bottom row. This is the glycerol stock of T9002. A bright band at ~2200bp corresponds to the expected T9002 sequence. A shorter, faint band, corresponding to the mutant T9002 can also be seen in lane 5. This shorter band is at the same length as the major product in lane 6, where the template is a colony from the mutant T9002 population.


