Endy:F2620/Figures
From OpenWetWare
Jump to navigationJump to search
-
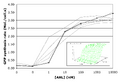 Figure 1 - Transfer function of F2620. The grey curves show measurements based on six individual colonies. The solid black curve represents the weighted mean of the measurements of the individual colonies. The weighting is calculated as the reciprocal of the square of the uncertainty (95% confidence interval) in the measurement of the individual colony. The inset shows the full time course, the main figure is the 30min timepoint of that surface.
 -
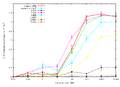 Figure 2 - Transfer functions of F2620 responding to 8 different input molecules. Standard deviation errors. The error bars should probably be converted into +/-95% confidence intervals.
 -
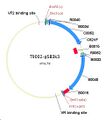 Figure 5 - T9002-pSB3k3 plasmid map (taken from T9002-pSB3k3.gb)
 -
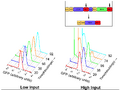 Figure 6 - Performance of T9002 over time under low and high input conditions. Inset shows the full T9002 device and the mutant version that took over the population after 74 doublings. The filled black arrows indicate the homologus regions (each 183bp).


