Endy:F2620/Data/Archive
Data Processing Details
(1/4/2006) Re-Runed all the codes and re-calibrated all the data to GFP/sec*OD. Calibration on lysate-based method failed because of high y-intercept. Produces artificially negative results. Subtracting media, media zero force and substraction with hard zero force failed. All results self consistent. All codes implement Barry's way of media subtraction.
(1/2/2006) Hi/Lo and Lo/Hi lantency obtained by fitting the curves to 3 piecewise smooth curves and then calculating
After 6 iterations the fit converged.
degrees of freedom (ndf) : 98
rms of residuals (stdfit) = sqrt(WSSR/ndf) : 16.1246
Final set of parameters Asymptotic Standard Error
a = 33.7955 +/- 2.773 (8.206%)
b = 67.8946 +/- 2.998 (4.416%)
c = 0.0207821 +/- 0.005015 (24.13%)
d = 0.0343945 +/- 0.004967 (14.44%)
dla x < a mamy: f(x) = b * erf(c * x * x)
dla x > a mamy: f(x) = b * exp(-d * (x - a))
t1= 1.46067min
t2 = 8.166min
t3 = 35.287
t4 = 120.89 (high :/)
errors only Gnuplot by http://mathworld.wolfram.com/Erf.html (ania)
(1/4/2006)CV troubles resolved
(4/6/2006) Barry:A lot of negative signal on spec data. Why was colony 7 not included in var while it has small error bars?
- Negative signal comes from the small window of averaging and subtraction of media time pt by time pt while the media has a noise not correlated with noise in data.
- The colony 7 was not included because it has a blip
(6/5/2005) Change data processing:
- Idea 1: bigger window averagin (9pt); don't subtract media at all
- Idea 2: get to dGFP/(dt*OD) with all the points and then fit a straight line to the steady state condition part. Removes ambiguity over size of the window but might be impractical
(6/6/2005) Example data anlysis on the sample done (for Idea2).
- Pick AHL4 b/c it was largerly negative before so easy to see difference
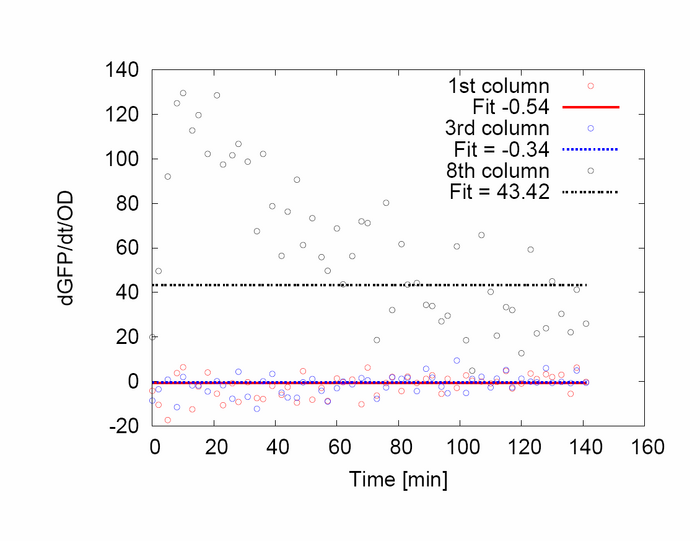
- Find dGFP/dt*OD and plot it vs t. Here are some problems
- the data are really spread. We never see it, or account for that when we just average!
- Fit line in steady state. Least squre fitting better than just average....
Here is a sample of couple of such fits:
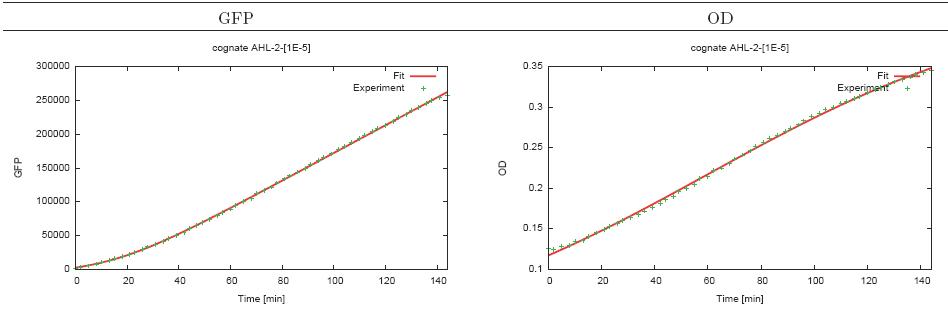
(7/6/2005) I tried fitting the plate reader abosrbance data (absorbance vs time) to the logistic equation (p176, Bioprocess Eng). I fit the cognate AHL data from the best specificity run. The fit uses nonlinear Chi^2 and looks quite good with reduced chi^2 of 1.01941e-006 erros for firitng parameters all below 1%. I also fited the acumulated GFP with h(x)=a*(x+(1/k)*exp(-k*x))+b and got a = 32.4889 +/- 5.553 (17.09%), k= 0.00871961 +/- 0.002199 (25.22%), b = -1464 +/- 1563(106.8%). Chi^2 is really bad b/c of b, but it does not matter because all we need for data process is a differential of that and b does not matter.
Data Analysis 2.0
New Idea for The Fitting Alghorytm
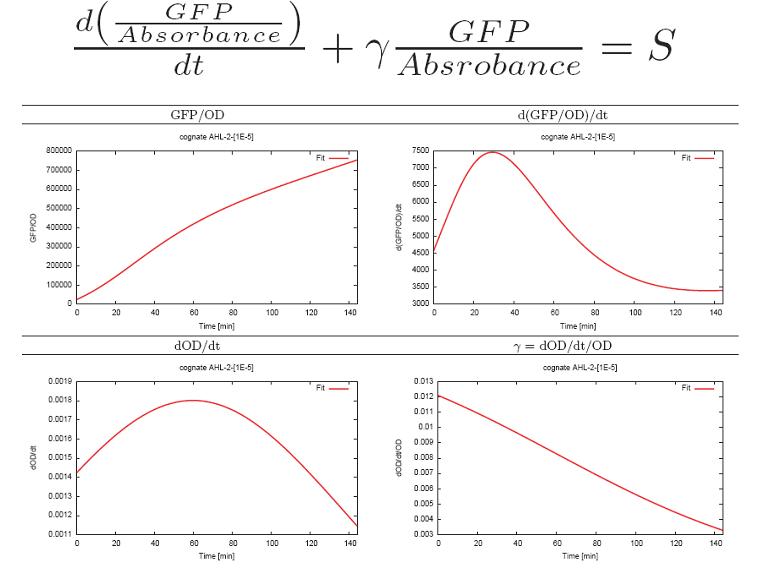
- Fit the Absorbance curve using logistic model and fit gfp to the int(a*OD)+b type of cunction using
the improved the Levenberg-Marquardt alghoritm.

- I think that most people who would read this will find the equations somewhat overly complicated (even thought the kai-squared values are good:)). Anyway that's easy enough to change later.
- I think that if you look at a residual plot of the OD data that you show below, that there will be a trend in the residuals, it looks like the fit could be a little bit better than it is currently.
- Calculate the constances in the equation by fitting:
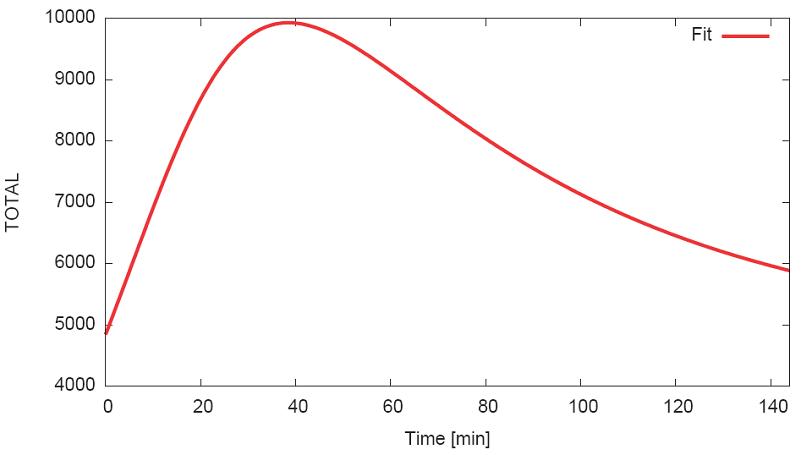
- Calculate steady state production level
- Plot steady state:
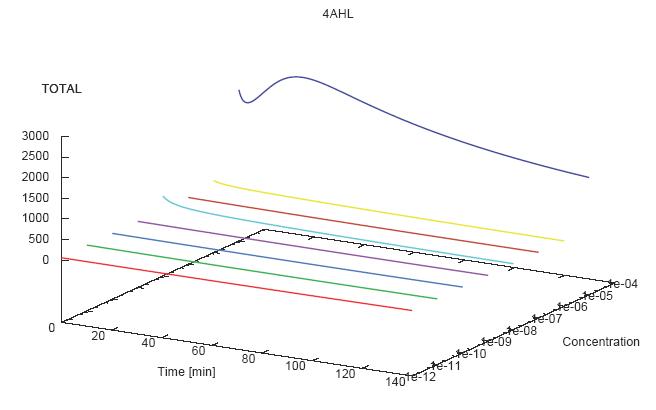
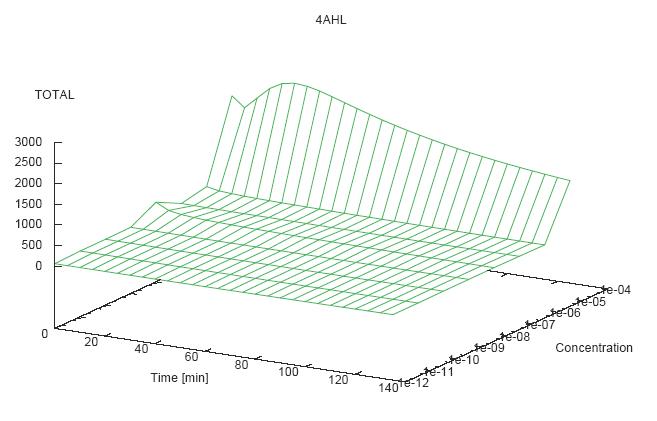
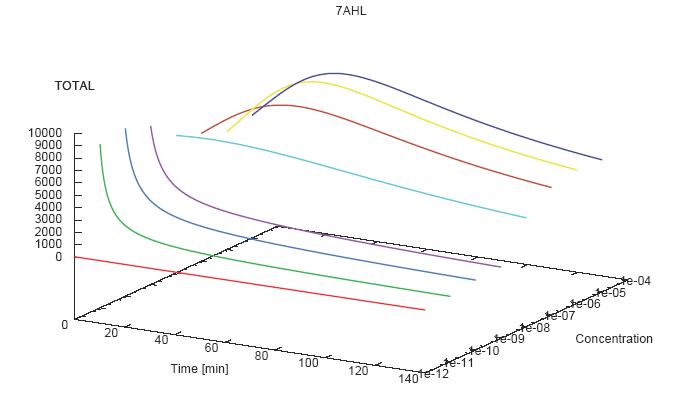
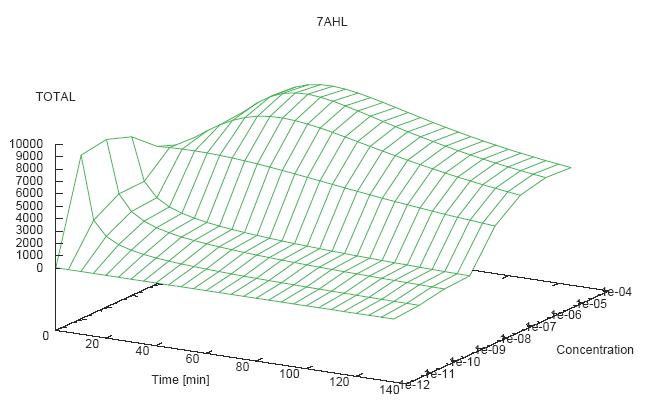
- Becuse there is no clear plateau plot 3D grpah with time, steady state and AHL concentration as axis and then pick one time slice.
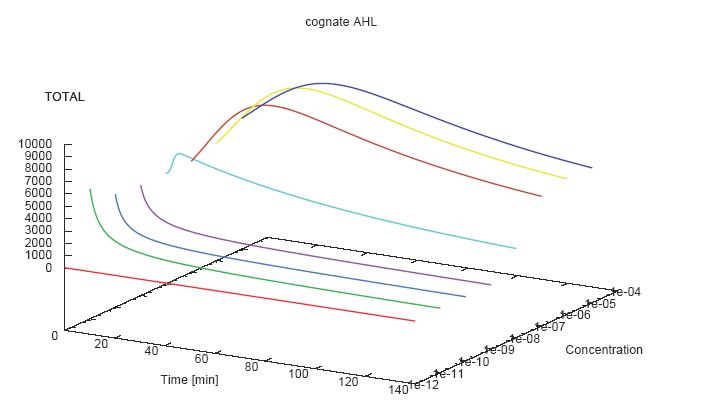
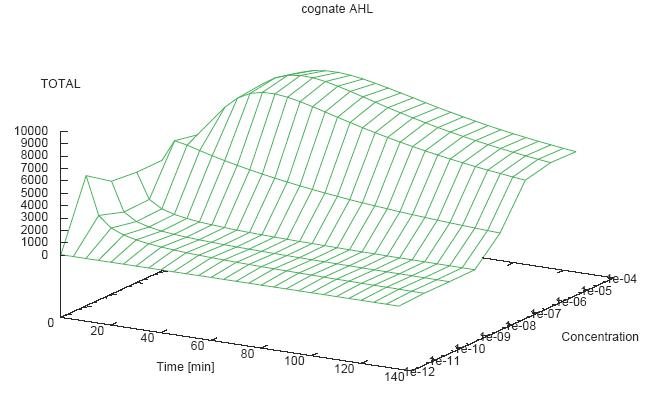
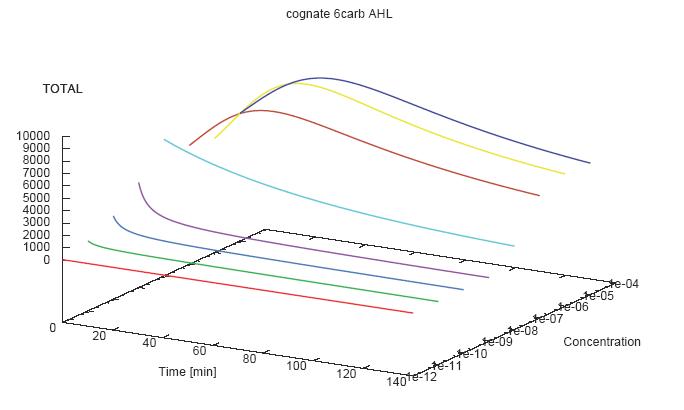
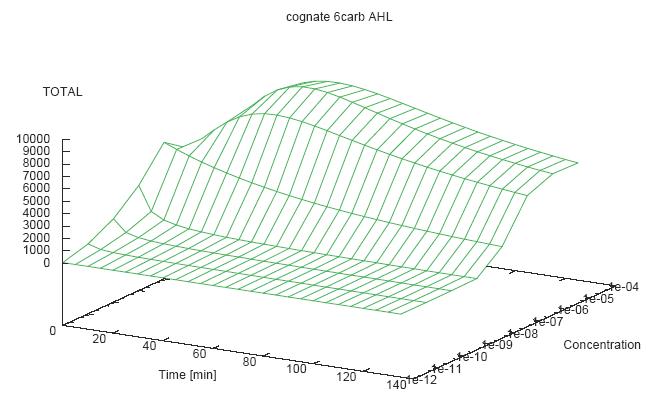
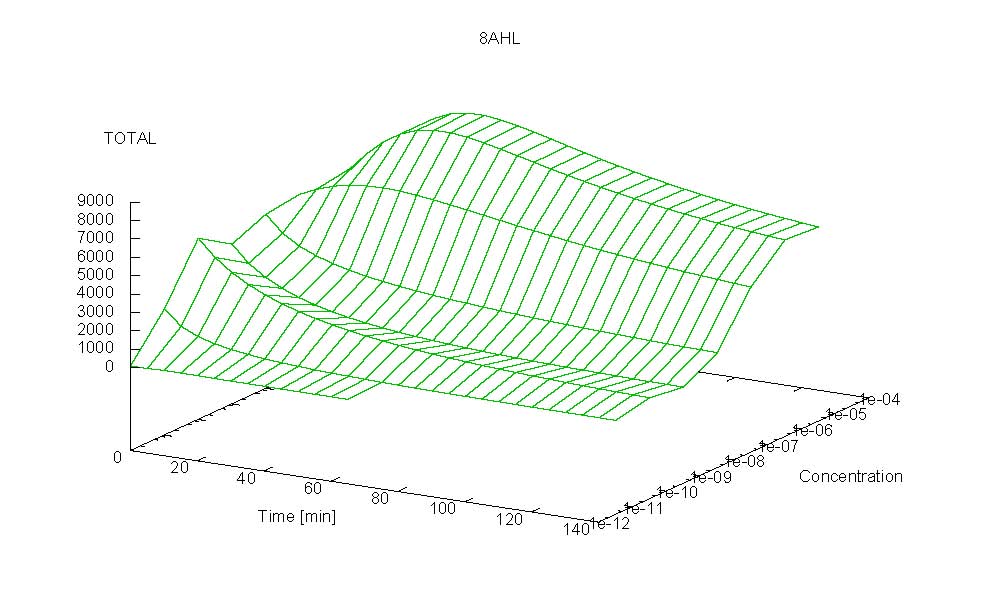
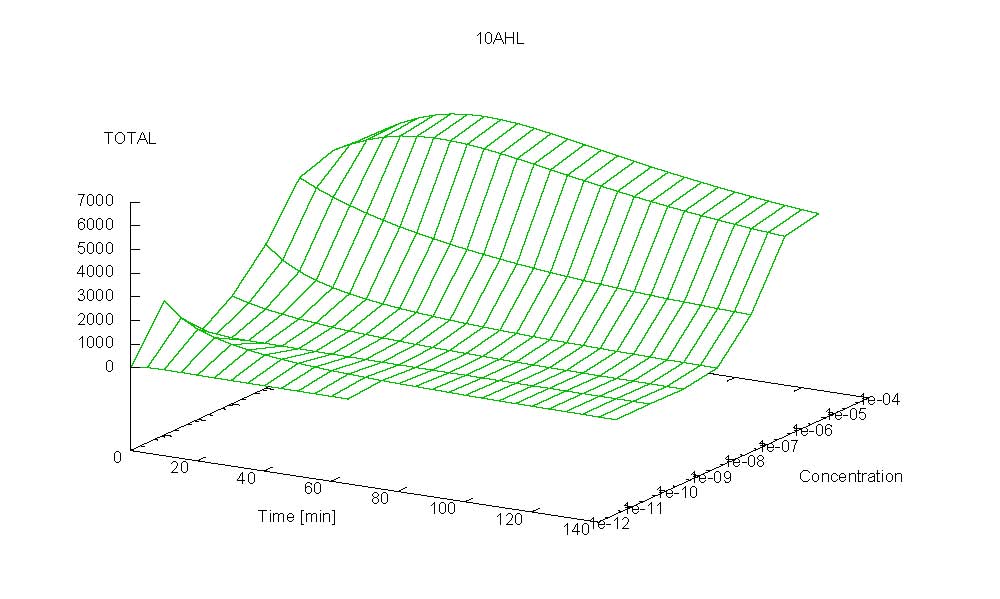
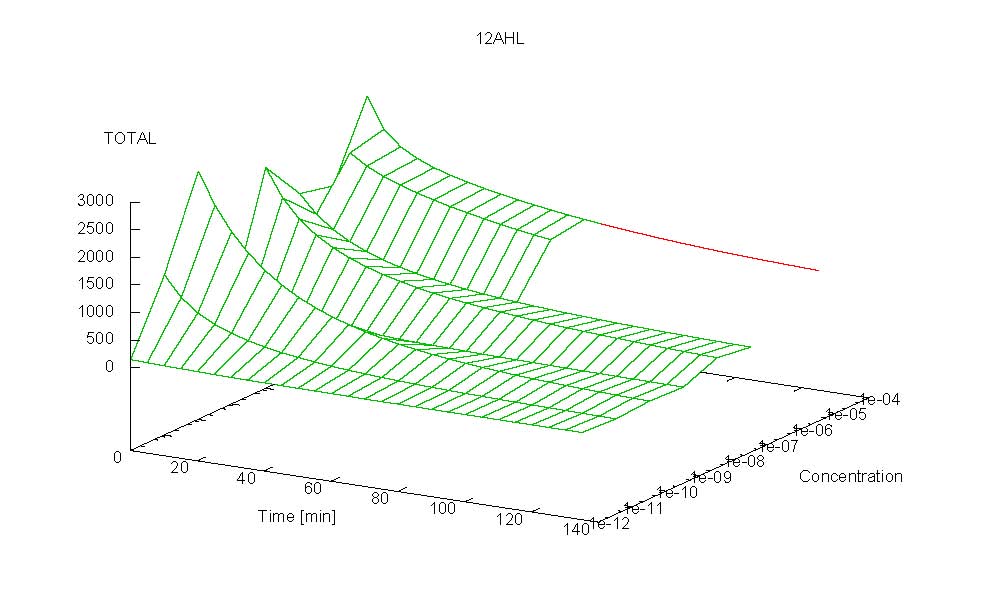
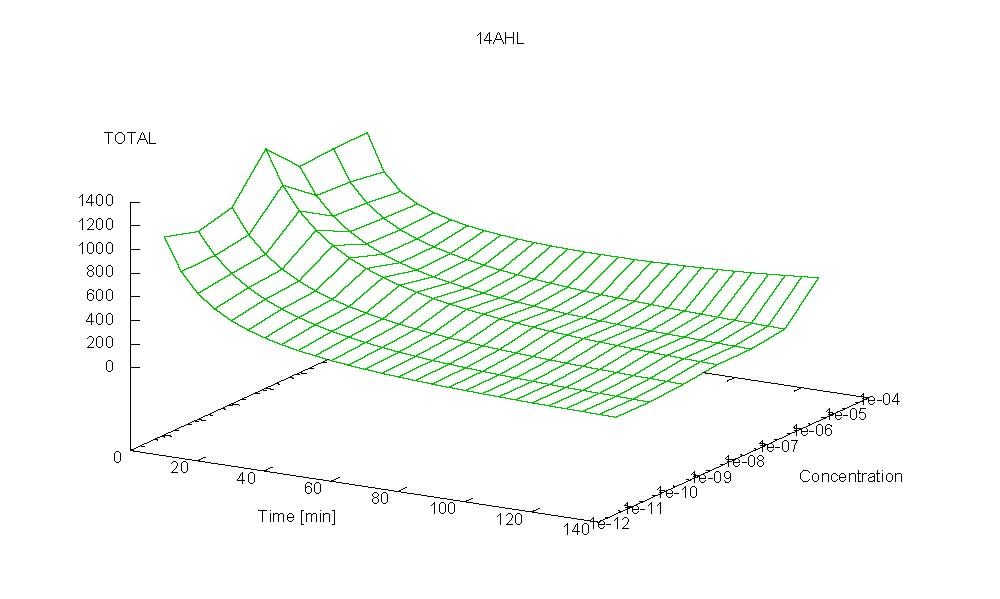
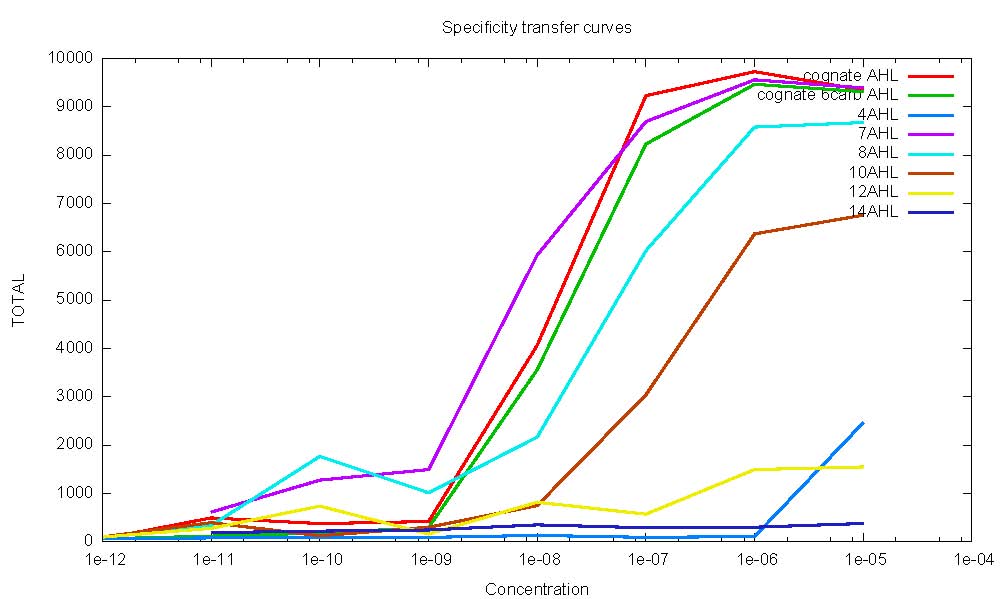
3D Plots for Specificity
(22/4/2006) There are still problems with those plots:
- they have spikes at t=1 - fixed
- the scale is 3 times as big as it should be (possibly problem with averaging)- idiotic problem with array poitners - fixed
- check them manually - done
- get the surfaces with interpolation
Graphs:
(24/03/06) I put currently all the writing that I have done regarding the project so far Some of it might be incorrect both stylistically or scientifically because it comes from the time when the project was incomplete. I will keep editing and correcting it (ania)
(28/03/06) First Nature Draft (ania)
(30/03/06) First Nature Draft corrected by barry. Targeted towards J&J (ania)
(1/4/2006) Final re-calibrated results uploaded. Commetnts on Processing added. Sequencing results are back. (ania)
(2/4/2006) Finished J&J submission and send. It containes very bad section on genetic stability, but it will be changed when we have more data. Posted as .pdf file Updated data sheet. Uploaded Moved Barry's drafts to Nature draft link. (ania)
(4/4/2006) Met Barry. Discussion on data analysis
(6/4/2006) Looked at the sequencing results (there are some issues). Done sample of new data analysis scheme. Added new paragraph to Drew's rewrite.
(7/4/2006)Met Barry. (More details here [1])
- compare primers sequence to the sequence I don't know the seq?
- e-mail sequences from day 5 that show mutation - done
- try to apply any of the growth models to the absorbance curves - done
- try to fit the fluorescence with exponential and find the asymptote - done
- calibrate using thse two curves rather than average - done
- think about the appropriate fitting alghoritm - done
(13/4/2006)Met Barry. We talked more about data processing.
(14/4/2006) Do:
- Use full model to fit the data - done
- Check "proof of concept" for sample data fitting full model - done & WORKS :)
- If that fails pick arbitrary OD - not needed
(13/4/2006)Met Barry.
- Ask about ethics mtg - can go!
- Data analysis plan - done
(13/4/2006)- (22/4/2006) Data Analysis
(22/4/2006)
- Discussion Secion and Abstract for 7.18 - written
- Specificity Analyzed! (small div problem which does not affect data - will work on it) - solved
(23/4/2006)
- Meet Barry to talk about data analysis - done
(24/4/2006)
- Barry to check data analysis
- ania to rewrite protocols
