Diedrichsen Lab:Test
Source
https://en.wikipedia.org/wiki/MATLAB
Syntax
The MATLAB application is built around the MATLAB scripting language. Common usage of the MATLAB application involves using the Command Window as an interactive mathematical shell or executing text files containing MATLAB code.[1]
Variables
Variables are defined using the assignment operator, =. MATLAB is a weakly typed programming language because types are implicitly converted.[2] It is an inferred typed language because variables can be assigned without declaring their type, except if they are to be treated as symbolic objects,[3] and that their type can change. Values can come from constants, from computation involving values of other variables, or from the output of a function. For example:
<source lang="matlab">
>> x = 17
x =
17
>> x = 'hat' x = hat
>> y = x + 0 y =
104 97 116
>> x = [3*4, pi/2] x =
12.0000 1.5708
>> y = 3*sin(x) y =
-1.6097 3.0000
</source>
Vectors and matrices
A simple array is defined using the colon syntax: init:increment:terminator. For instance:
<source lang="matlab">
>> array = 1:2:9
array =
1 3 5 7 9
</source>
defines a variable named array (or assigns a new value to an existing variable with the name array) which is an array consisting of the values 1, 3, 5, 7, and 9. That is, the array starts at 1 (the init value), increments with each step from the previous value by 2 (the increment value), and stops once it reaches (or to avoid exceeding) 9 (the terminator value).
<source lang="matlab">
>> array = 1:3:9
array =
1 4 7
</source> the increment value can actually be left out of this syntax (along with one of the colons), to use a default value of 1. <source lang="matlab"> >> ari = 1:5 ari =
1 2 3 4 5
</source>
assigns to the variable named ari an array with the values 1, 2, 3, 4, and 5, since the default value of 1 is used as the incrementer.
Indexing is one-based,[4] which is the usual convention for matrices in mathematics, although not for some programming languages such as C, C++, and Java.
Matrices can be defined by separating the elements of a row with blank space or comma and using a semicolon to terminate each row. The list of elements should be surrounded by square brackets: []. Parentheses: () are used to access elements and subarrays (they are also used to denote a function argument list).
<source lang="matlab"> >> A = [16 3 2 13; 5 10 11 8; 9 6 7 12; 4 15 14 1] A =
16  3  2 13
 5 10 11  8
 9  6  7 12
 4 15 14  1
>> A(2,3) ans =
11
</source>
Sets of indices can be specified by expressions such as "2:4", which evaluates to [2, 3, 4]. For example, a submatrix taken from rows 2 through 4 and columns 3 through 4 can be written as: <source lang="matlab"> >> A(2:4,3:4) ans =
11 8
7 12
14 1
</source> A square identity matrix of size n can be generated using the function eye, and matrices of any size with zeros or ones can be generated with the functions zeros and ones, respectively. <source lang="matlab"> >> eye(3,3) ans =
1 0 0
0 1 0
0 0 1
>> zeros(2,3) ans =
0 0 0
0 0 0
>> ones(2,3) ans =
1 1 1
1 1 1
</source>
Most MATLAB functions can accept matrices and will apply themselves to each element. For example, mod(2*J,n) will multiply every element in "J" by 2, and then reduce each element modulo "n". MATLAB does include standard "for" and "while" loops, but (as in other similar applications such as R), using the vectorized notation often produces code that is faster to execute. This code, excerpted from the function magic.m, creates a magic square M for odd values of n (MATLAB function meshgrid is used here to generate square matrices I and J containing 1:n).
<source lang="matlab"> [J,I] = meshgrid(1:n); A = mod(I + J - (n + 3) / 2, n); B = mod(I + 2 * J - 2, n); M = n * A + B + 1; </source>
Structures
MATLAB has structure data types.[5] Since all variables in MATLAB are arrays, a more adequate name is "structure array", where each element of the array has the same field names. In addition, MATLAB supports dynamic field names[6] (field look-ups by name, field manipulations, etc.). Unfortunately, MATLAB JIT does not support MATLAB structures, therefore just a simple bundling of various variables into a structure will come at a cost.[7]
Functions
When creating a MATLAB function, the name of the file should match the name of the first function in the file. Valid function names begin with an alphabetic character, and can contain letters, numbers, or underscores. Functions are also often case sensitive.
Function handles
MATLAB supports elements of lambda calculus by introducing function handles,[8] or function references, which are implemented either in .m files or anonymous[9]/nested functions.[10]
Classes and object-oriented programming
MATLAB supports object-oriented programming including classes, inheritance, virtual dispatch, packages, pass-by-value semantics, and pass-by-reference semantics.[11] However, the syntax and calling conventions are significantly different from other languages. MATLAB has value classes and reference classes, depending on whether the class has handle as a super-class (for reference classes) or not (for value classes).[12]
Method call behavior is different between value and reference classes. For example, a call to a method <source lang="matlab"> object.method(); </source> can alter any member of object only if object is an instance of a reference class.
An example of a simple class is provided below.
<source lang="matlab"> classdef hello
   methods
       function greet(this)
           disp('Hello!')
       end
   end
end </source>
When put into a file named hello.m, this can be executed with the following commands: <source lang="matlab"> >> x = hello; >> x.greet(); Hello! </source>
Graphics and graphical user interface programming
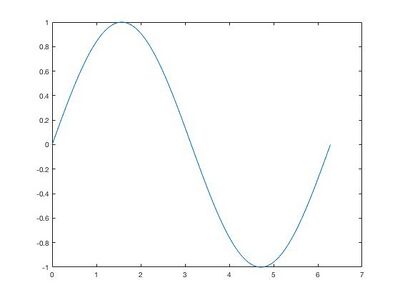
MATLAB supports developing applications with graphical user interface (GUI) features. MATLAB includes GUIDE[13] (GUI development environment) for graphically designing GUIs.[14] It also has tightly integrated graph-plotting features. For example, the function plot can be used to produce a graph from two vectors x and y. The code: <source lang="matlab"> x = 0:pi/100:2*pi; y = sin(x); plot(x,y) </source> produces the following figure of the sine function:

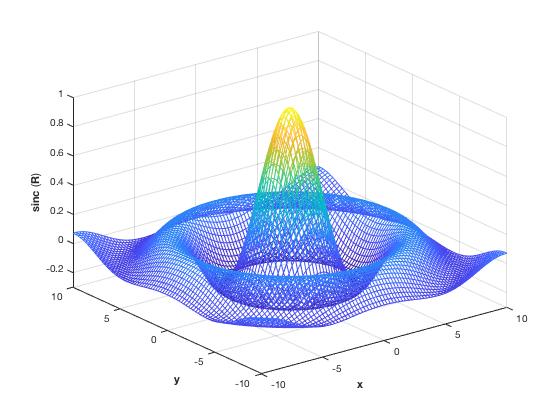
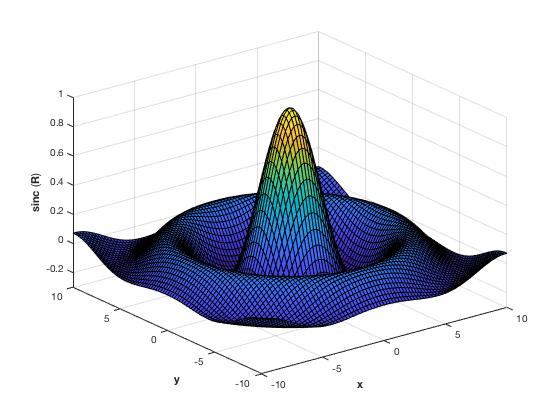
A MATLAB program can produce three-dimensional graphics using the functions surf, plot3 or mesh.
| <source lang="matlab">[X,Y] = meshgrid(-10:0.25:10,-10:0.25:10);
f = sinc(sqrt((X/pi).^2+(Y/pi).^2)); mesh(X,Y,f); axis([-10 10 -10 10 -0.3 1]) xlabel('{\bfx}') ylabel('{\bfy}') zlabel('{\bfsinc} ({\bfR})') hidden off </source> |
<source lang="matlab">
[X,Y] = meshgrid(-10:0.25:10,-10:0.25:10); f = sinc(sqrt((X/pi).^2+(Y/pi).^2)); surf(X,Y,f); axis([-10 10 -10 10 -0.3 1]) xlabel('{\bfx}') ylabel('{\bfy}') zlabel('{\bfsinc} ({\bfR})') </source> | |
| This code produces a wireframe 3D plot of the two-dimensional unnormalized sinc function: | This code produces a surface 3D plot of the two-dimensional unnormalized sinc function: | |

|

|
In MATLAB, graphical user interfaces can be programmed with the GUI design environment (GUIDE) tool.[15]
Misc
<source lang="matlab"> function s = corner_sum(M)
s = M(1,1)+M(1,end)+M(end,1)+M(end,end);
>> test = [1 2 3; 4 5 6; 7 8 9];
>> test1 = corner_sum(test)
test1 =
20
</source>
- ↑ http://en.wikipedia.org/wiki/Oil-drop_experiment
- ↑ http://en.wikipedia.org/wiki/Oil-drop_experiment
- ↑ http://en.wikipedia.org/wiki/Oil-drop_experiment
- ↑ http://en.wikipedia.org/wiki/Oil-drop_experiment
- ↑ http://en.wikipedia.org/wiki/Oil-drop_experiment
- ↑ http://en.wikipedia.org/wiki/Oil-drop_experiment
- ↑ Considering Performance in Object-Oriented MATLAB Code, Loren Shure, MATLAB Central, 26 March 2012: "function calls on structs, cells, and function handles will not benefit from JIT optimization of the function call and can be many times slower than function calls on purely numeric arguments"
- ↑ http://en.wikipedia.org/wiki/Oil-drop_experiment
- ↑ http://en.wikipedia.org/wiki/Oil-drop_experiment
- ↑ http://en.wikipedia.org/wiki/Oil-drop_experiment
- ↑ http://en.wikipedia.org/wiki/Oil-drop_experiment
- ↑ http://en.wikipedia.org/wiki/Oil-drop_experiment
- ↑ http://en.wikipedia.org/wiki/Oil-drop_experiment
- ↑ http://en.wikipedia.org/wiki/Oil-drop_experiment
- ↑ Template:Cite book