Biomod/2014/Fluorescence
<html>
<head>
 <title> Mainpage </title>
  <style>
    body{
    align: left;
    width: 1200px;
    height: auto;
    margin: 0 auto;
    background-color:#be1e3c;
    border:#be1e3c thin solid;
    }
    #goTopBtn {POSITION: fixed;TEXT-ALIGN: center;LINE-HEIGHT: 30px;WIDTH: 100px;BOTTOM: 35px;HEIGHT: 100px;FONT-SIZE: 12px;RIGHT: 30px;}
    #content{margin:0;padding:0;border:0px;}
      /*hidden section*/
      .firstHeading{display:none;}
      #sidebar-main{display:none;}
      #p-cactions{display:none;}
      #p-personal{display:none;}
   </style>
</head>
<body>
<a href="http://www.tu-braunschweig.de/index.html"><img src="http://openwetware.org/images/thumb/2/27/Nanoscooter_TUBS-siegel.jpg/800px-Nanoscooter_TUBS-siegel.jpg" width="383" height="142" alt="Logo TU Braunschweig"></a> |
<img src="http://openwetware.org/images/thumb/c/c3/Nanoscooter_Gruppenfoto-Banner.jpg/800px-Nanoscooter_Gruppenfoto-Banner.jpg" width="463" height="142" alt="our group" title="our group (Nanoscooter) for Biomod competition"> |
<img src="http://openwetware.org/images/2/24/Nanoscooter.jpg" width="165" height="142" alt="Logo Nanoscooter"> |
|---|
Team Nanoscooter Braunschweig
<style type="text/css"> body { height:500px; } div { }
</style> <body> <a href="Braunschweig"><img src="http://openwetware.org/images/b/bf/Zur%C3%BCckpfeil.png"
width="103" height="88" alt="Back"align="left"></a>
|
Molecules are known to have discrete levels of energy. Without any stimulation the molecules are in the so called ground state. If it is excited by irradiation of visible light, the molecule absorbs energy to reach higher – so called excited states – levels. These energy packages can be described as photons of different wavelengths. The molecule can also relax back into the ground state while emitting a photon, this process is known as emission. The energy of a photon is described by the Planck´s law.[1]
This equation uses c and h which are the constants for speed of light in vacuum and the Planck constant. Further λ is used as wavelength.
<img src="http://openwetware.org/images/thumb/8/83/Jablonski.png/800px-Jablonski.png" width="75%" height="75%" >
Figure 1: Jablonski-Diagramm with radiative transitions like absorption (light-blue), fluorescence (violet) and phosphorescence (orange) and radiationless transitions like internal conversion (dashed grey) and intersystem crossing (dashed red). Figure 2 shows excitation (green) and emission spectrum (dashed green) of the dye Atto 532. <img src="http://openwetware.org/images/thumb/6/62/Atto_532.png/800px-Atto_532.png" width="75%" height="75%" > Figure 2: Excitation (green) and emission spectrum (dashed green) of the dye Atto 532.[3]
The emission spectrum is the mirror image of the excitation spectrum. This could be explained by the Stokes-Shift. The Stoke-Shift depends on two different effects the variation of the vibronal states and the solvent relaxation.
The first effect describes that an excitation not only changes the ground state to an excitation state but also changes the vibronal state. To determine fluorescence it is necessary that the lowest vibronal state of the singlet-state is reached. The internal conversion makes this possible. The lost energy results in a higher wavelength.
The reorganization of a polar solvate in a polar solvent after excitation is described by the solvent relaxation. The solvent is aligned by the dipole moment μ of dissolved dyes. After an excitation the dipole moment could stabilize (μ ≤ μ*) or destabilize (μ > μ*) the dyes which results in a higher or lower energy and also in a lower or higher wavelength.[4] <img src="http://openwetware.org/images/a/a4/Weitfeld.png" width="" height="" >
Figure 3: Schematic of a widefield microscope. The sample is irradiated with laser light, while the excitation and the fluorescence are separated by a dichroic beamsplitter. A CCD camera is used for detection.[3]
To ensure that the fluorescent beads are bound to the Nanoscooter and are not only free fluorescent beads (which would look exactly the same on a fluorescence microscope), the Nanoscooter was labeled with red fluorophores (Atto647N) by so called external labeling.[8] <img src="http://openwetware.org/images/thumb/6/6b/Scooter_III.png/800px-Scooter_III.png" width="" height="" > Figure 5: Schematic illustration of the Nanoscooter colabeled with a fluorescent bead and red fluorophores. Further purification proofed difficult since the fluorescent beads have the similar size to the DNA origami hence the standard filtering does not work. Moreover, the attempt to purify via gel electrophoresis failed (as illustrated in Figure 3): A very blurred fluorescent signal was received with UV illumination and therefore the DNA origami could not be extracted. <img src="http://openwetware.org/images/thumb/3/3f/Gel.png/756px-Gel.png" width="75%" height="75%" > Figure 6: Gel electrophoresis of the DNA origami labeled with a fluorescent bead. The 1st lane shows the fluorescent beads only, 2nd-4th lane show Nanoscooter labeled with fluorescent beads and the 5th lane shows the scaffold p8064 as reference.
First, the samples were prepared on standard microscope coverslips (#1.5, 0.17 mm thick) to check for correct fluorescence labeling. For this, the glass surface was coated with poly-L-lysin (PLL) (1:100 diluted with PBS) which enables electrostatic binding of the negatively charged DNA as it creates a positively charged surface.
Since the sample could not easily be purified, the yield of colabeled spots was determined by fluorescence microscopy. Colocalization of red fluorophores and yellow green fluorescent beads was expected for successfully colabeled DNA origamis. First, the colocalization was measured for a simple rectangular DNA origami because this structure is well known and the colocalization was more likely to be observed. The fluorescence image is shown in Figure 7. <img src="http://www.openwetware.org/images/c/c4/NRO_Kolokalisation.png" width="" height="" > Figure 7: Fluorescence microscopy of colabeled rectangular DNA origamis (the colocated spots are framed by white circles). It is obvious that the labeling worked out for the rectangular DNA origami, so the Nanoscooter was labeled using the same conditions, whereby the observed fluorescence image is shown in Figure 8. <img src="http://openwetware.org/images/c/c8/Scooternotcol.jpg" width="" height="" > Figure 8: Fluorescence microscopy of the colabeled Nanoscooter.
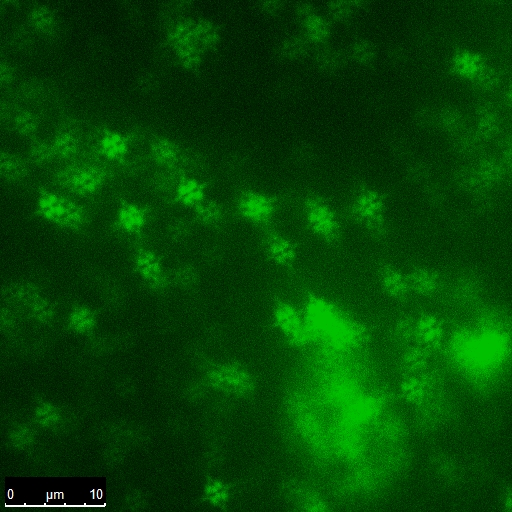
Unfortunately, the colocalization could not be observed for the Nanoscooter. We are positive that the red spots correspond to labeled Nanoscooter since the brightness and photophysical behavior was as expected. But because of the lack of colocalization, we conclude that the fluorescent beads have not bound to the Nanoscooter. A likely reason for this observation could be steric hindrance: As the biotins are incorporated using quite short linkers, they might not be accessible to the StreptAvidin coated fluorescent bead. By using a longer linker between the DNA origami construct and the biotin this problem could be solved in future applications. <img src="http://www.openwetware.org/images/2/2b/Doppelbrechung.jpg" width="" height="" > Figure 9: Fluorescence microscopy image of yellow green fluorescent beads through a mica sheet.
Since mica sheets probably have a very heterogeneous structure, the resulting fluorescence image shows optical aberrations [10] (Figure 9) which might be caused by birefringence.[11] Unfortunately, this made fluorescence experiments on the applied inverse microscope impossible.
|
</body>
</html>
