Biomod/2011/Caltech/DeoxyriboNucleicAwesome/Random Walk Formula
|
Thursday, January 29, 2026
|
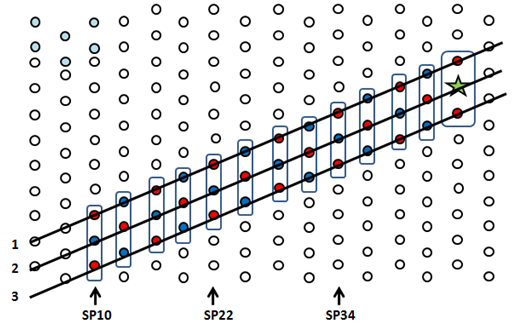
Random Walk FormulaModeling IdeaThe random walk on DNA origami can be modeled as one dimensional random walk with a reflecting and an absorbing barrier (Figure 1). Tracks in the same column are grouped into rectangles, and each step is defined as walking from one rectangle to an adjacent one. We are interested in expressing the probability of reaching the walker goal as a function of the number of steps taken.
 Consider a random walk on a line segment with N+1 sites denoted by integers (0,1,2, … , N) (Figure 2). The walker starts random walk at site i, 0 < i ≤ N. Let p be the probability for the walker to move one segment to the left, q be the probability for the walker to move one segment to the right. The probability for the walker to stay at a particular site for the next unit time is thus r = 1 – p – q. When the walker reaches site N, the partially reflecting barrier, it has a probability of β to be reflected back to site N – 1, and a probability of α = 1 – β to stay at site N in the next unit time. When reaching site 0, the absorbing barrier, it stays there for 100% probability and the random walk ends.  General ApproachTwo assumptions are made in our case. 1) The DNA origami is immune to any free floating walkers in solution, meaning that free floating walkers cannot bind to an origami and starts random walking; 2) walkers are immediately absorbed when reaching the rectangles with WGs, despite the presence of two TR2 in the same rectangle. Let [math]\displaystyle{ h(t;i)\! }[/math] be the probability that the walker reaches 0 for the first time after [math]\displaystyle{ t\! }[/math] steps given its starting position being [math]\displaystyle{ i\! }[/math]. [math]\displaystyle{ h(t;i)\! }[/math] obeys the following difference equation [math]\displaystyle{ h(t;i) = q·h(t-1;i-1) + r·h(t-1;i) + p·h(t-1; i + 1)\! }[/math]
for [math]\displaystyle{ t = 1,2,3,...\! }[/math] and [math]\displaystyle{ i = 1,2,3,...,N-1\! }[/math]. We define [math]\displaystyle{ h(t;0)= 1\! }[/math] [math]\displaystyle{ if\! }[/math] [math]\displaystyle{ t = 0\! }[/math]; [math]\displaystyle{ h(t;0)= 0\! }[/math] [math]\displaystyle{ if\! }[/math] [math]\displaystyle{ t \gt 0\! }[/math]. Also, [math]\displaystyle{ h(t;i) = 0\! }[/math] [math]\displaystyle{ for\! }[/math] [math]\displaystyle{ t \lt i\! }[/math]. When [math]\displaystyle{ i = N\! }[/math] we have [math]\displaystyle{ h(t;N) = αh(t-1;N)+ βh(t-1; N-1) \! }[/math]
The generating function for [math]\displaystyle{ h(t;i)\! }[/math] can be expressed as [math]\displaystyle{ H_i (s) = \sum_{t=0}^\infty h(t;1)s^t,|s| \lt 1 \! }[/math]
Following Netus (1963), the explicit expression of the generating function is [math]\displaystyle{ H_i (s) =\begin{cases} \frac {q^i s^i T_i (s)} {T_0 (s)}, 0\leqslant i \lt N\\
\frac {\beta q^{N-1} s^N (\lambda_1 - \lambda_2)} {T_0 (s)},i=N\end{cases}\! }[/math]
where [math]\displaystyle{ T_i (s) = (1-\alpha s)(\lambda_1 ^{N-i}-\lambda_2 ^{N-i})-\beta p s^2 (\lambda_1 ^{N-i-1}-\lambda_2 ^{N-i-1})\! }[/math]
and [math]\displaystyle{ \lambda_{1,2} = \frac {1} {2} ( \pm \sqrt{{(1-rs)}^2-4 p q s^2} +1-rs ).\! }[/math]
The explicit expression of [math]\displaystyle{ h(t;i)\! }[/math] can thus be deduced from [math]\displaystyle{ H_i (s)\! }[/math] using partial fraction expansion (Feller, 1971). Assume that [math]\displaystyle{ T_0 (s)\! }[/math] has [math]\displaystyle{ k\! }[/math] distinct roots [math]\displaystyle{ s_1,s_2,..., s_k . H_i (s)\! }[/math] can then be decomposed into partial fractions [math]\displaystyle{ H_i (s) = \frac {\rho_1} {s-s_1} + \frac{\rho_2}{s-s_2} +...+ \frac {\rho_k}{s-s_k} \! }[/math]
where [math]\displaystyle{ \rho_k = \frac {-q^i {s_m}^i T_i (S_m)}{{T_0}^' (s_m)}, m\leqslant k \! }[/math]
It follows that [math]\displaystyle{ h(t;i) = \sum_{m=1}^k \frac {\rho_m}{{s_m}^{t+1}} \! }[/math]
[math]\displaystyle{ h(t;N)\! }[/math] can be similarly deduced from [math]\displaystyle{ H_N (s)\! }[/math] using the same method. Parameter EstimationPossible positions of walkers on the origami can be grouped into two categories, either in the center of rectangles (Figure 1, Line 2) or at the sides (Figure 1, Lines 1&3), and the values of [math]\displaystyle{ p\! }[/math], [math]\displaystyle{ q\! }[/math] and [math]\displaystyle{ r\! }[/math] are different in each category. Hence there is a need to find out the distribution of walkers in these two categories in order to estimate [math]\displaystyle{ p\! }[/math], [math]\displaystyle{ q\! }[/math] and [math]\displaystyle{ r\! }[/math]. Assuming no reflecting boundaries, when the walker is in the center (Figure 1, Line 2), the probability of staying in Line 2 after one branch migration is [math]\displaystyle{ \frac {1}{2}\! }[/math], while the probability of going to Lines 1 or 3 is [math]\displaystyle{ \frac{1}{2}\! }[/math]. Similarly, when it is in Lines 1 or 3, the probability of staying in the same line after one branch migration is [math]\displaystyle{ \frac{2}{3}\! }[/math] while the probability of going to Line 2 is [math]\displaystyle{ \frac{1}{3}\! }[/math]. Here we assume no reflecting barrier in the system. The distribution of relative positions of walkers can be modeled using Markov chain as follows. Let [math]\displaystyle{ v(t) = (a, 1-a)\! }[/math] denote the proportion of walkers in Line 2 [math]\displaystyle{ (a) }[/math] and Lines 1&3 [math]\displaystyle{ (1-a) }[/math] after [math]\displaystyle{ t\! }[/math] branch migrations. Since all the walkers are initially planted in the center, [math]\displaystyle{ v(0) = (1, 0)\! }[/math]. Define the transition matrix [math]\displaystyle{ M = \begin{pmatrix}
1/2 & 1/2 \\
1/3 & 2/3
\end{pmatrix}. \! }[/math]
It follows that [math]\displaystyle{ v(t)=v(0). \underbrace{M.M.M...M}_{t} \! }[/math]
It was found that [math]\displaystyle{ \lim_{t \to \infty} v(t)= (0.4,0.6). }[/math]Hence at the stable state, 40% of the walkers are in Line 2 while 60% are in Lines 1 or 3. Since [math]\displaystyle{ v(4) = v(4) = (0.40007,0.59993)\! }[/math], the distribution of relative positions of walkers on the origami stabilizes after approximately 4 branch migrations. The overall probabilities [math]\displaystyle{ p, q, r, \alpha,\beta\! }[/math] can thus be calculated (Table 1).
Explicit Expression of FormulaeThe explicit expression for the probability of reaching the walker goal (h(t;i)) as a function of the number of steps taken (t) can then be deduced using the general approach and the estimated parameters. [math]\displaystyle{ SP10: h(t;12)= \begin{cases} 0, 0\leqslant t \lt 12\\ \frac{8.4287}{19.6975^{t+1}} - \frac{0.6389}{7.5119^{t+1}} + \frac{0.0938}{5.4569^{t+1}} + \frac{0.0064}{1.0050^{t+1}} - \frac{0.0202}{1.0463^{t+1}} + \frac{0.0378}{1.1365^{t+1}} \\ \quad - \frac{0.0634}{1.2945^{t+1}} + \frac{0.1058}{1.5602^{t+1}} - \frac{0.1876}{2.0242^{t+1}} + \frac{0.3811}{2.9273^{t+1}} - \frac{1.0555}{5.1593^{t+1}} + \frac{8.7388}{16.5916^{t+1}} ,t \geqslant 12\end{cases} }[/math]
Cumulative FunctionThe cumulative density function of [math]\displaystyle{ h(t;i)\! }[/math] can be computed and used to fit with SPEX experimental data. [math]\displaystyle{ C(t;i)= \sum_{t=0}^\infty h(t;i)\! }[/math]
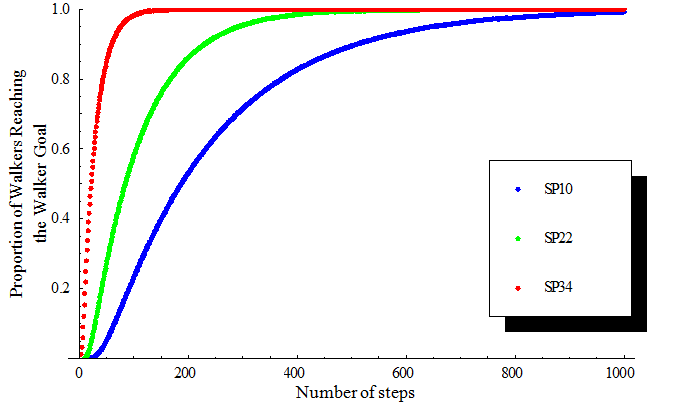
A plot of [math]\displaystyle{ C(t;i)\! }[/math] verses [math]\displaystyle{ t\! }[/math] can be used as a good model to fit the experimental data (Figure 3), where [math]\displaystyle{ C(t;i) }[/math] is the proportion of walkers that reach the walker goal and [math]\displaystyle{ t\! }[/math] is the number of steps needed. It can be found that the number of steps needed for half of the walkers to reach WG decreases as we move SP nearer to the WG.  Number of Branch Migrations per StepTo further study the validity of this model, the number of branch migrations per step was calculated in order to obtain the average rate of branch migration. Let [math]\displaystyle{ P(x)\! }[/math] denote the probability of walking to the adjacent column after [math]\displaystyle{ x\! }[/math] branch migrations. For walkers at the center line(Line 2), [math]\displaystyle{ P(x) =\begin{cases} \frac {1} {2} \times ({\frac{2}{3}})^{\frac{x}{2}} \times ({\frac{1}{4}})^{\frac{x-2}{2}}, x=2,4,6,8,...\\
\frac {1}{2} \times ({\frac {2}{3}})^{\frac{x-1}{2}} \times ({\frac{1}{4}})^{\frac {x-1}{2}},x=1,3,5,7,...\end{cases} \! }[/math]
[math]\displaystyle{ P(x) =\begin{cases} \frac {2} {3} \times ({\frac{1}{4}})^{\frac{x}{2}} \times ({\frac{2}{3}})^{\frac{x-2}{2}}, x=2,4,6,8,...\\
\frac {2}{3} \times ({\frac {1}{4}})^{\frac{x-1}{2}} \times ({\frac{2}{3}})^{\frac {x-1}{2}},x=1,3,5,7,...\end{cases} \! }[/math]
[math]\displaystyle{ \sum_{x=1}^\infty xP(x),x=1,2,3,4,... \! }[/math]
It follows that the expected number of branch migrations per step is [math]\displaystyle{ \frac{9}{5}\! }[/math] and [math]\displaystyle{ \frac{8}{5} }[/math] for walkers at the center and sides, respectively. Taking into account that 40% of walkers are in Line 2 while 60% are in Lines 1 and 3, the overall number of branch migrations per step is thus [math]\displaystyle{ 40% \times \frac{9}{5} + 60% \times \frac{8}{5} = 1.68 }[/math]
References
|
