Biogang:Projects/Bioinformatics Career Survey 2008 Results
From OpenWetWare
Jump to navigationJump to search
Please post results derived from the career survey here, with your name and link back to your own blog or website (if you have one). All data posted here has a Creative Commons Attribution, Non-Commercial, Share Alike License.
Happiness
-
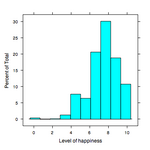 Histogram of bioinformatican happiness. Michael Barton
 -
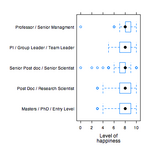 Box and whisker plot of bioinformatician happiness factored by career position. Michael Barton
 -
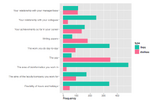 Frequency barplot of bioinformatician likes and dislikes. Michael Barton


Research Areas
-
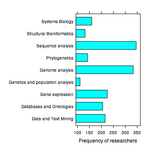 Barplot of frequency of research areas. Michael Barton
 -
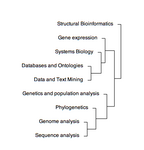 Dendrogram of bioinformatics research area clustering. Michael Barton
 -
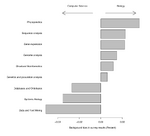 Biology/Computer Science background bias in bioinformatics research areas. Michael Barton


Programming Languages
-
 Barplot of programming languages appearing in the survey at least 10 times. Michael Barton

Tools & Applications
-
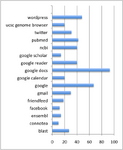 Barplot of applications appearing in the survey at least 10 times. Rebecca J. Holz
 -
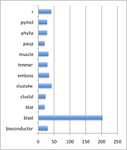 Barplot of tools appearing in the survey at least 20 times. Rebecca J. Holz


Salary
Very quick and dirty look at salaries in industry vs. academia:
- Academic Salary Mean/Median: $36,520 / $33,712
- Industry Salary Mean/Median: $66,239 / $64,235
Salary/Years Experience:
- Academic Mean/Median: $10,970 / $8,333
- Industry Mean/Median: $17,410 / $12,000
