BioSysBio:abstracts/2007/Royer Loic
Visualising Protein Interaction Networks with Power Graphs
Author(s): Loïc Royer, Matthias Reimann, Bill Andreopoulos, Michael Schroeder
Affiliations: TU Dresden
Contact:email: royer@biotec.tu-dresden.de
Keywords: 'protein interaction networks' 'visualization' 'scale-free' 'power graphs'
Introduction
Currently, much research is devoted to the study of protein interaction networks. Novel high-throughput technologies produce large networks, which are complemented by interactions manually or automatically extracted from scientific articles. While the structure of these networks has been widely studied, their visualization remains an unsolved problem. Here, we combine both. Through an understanding of the modular nature of the networks we are able to define a novel visualization and layout. The key idea of the approach is the identification of modules, which form the complex core of these networks and which share many interaction partners. The corresponding edges to these partners are aggregated and lead to a reduction of edges to be laid out.
Idea
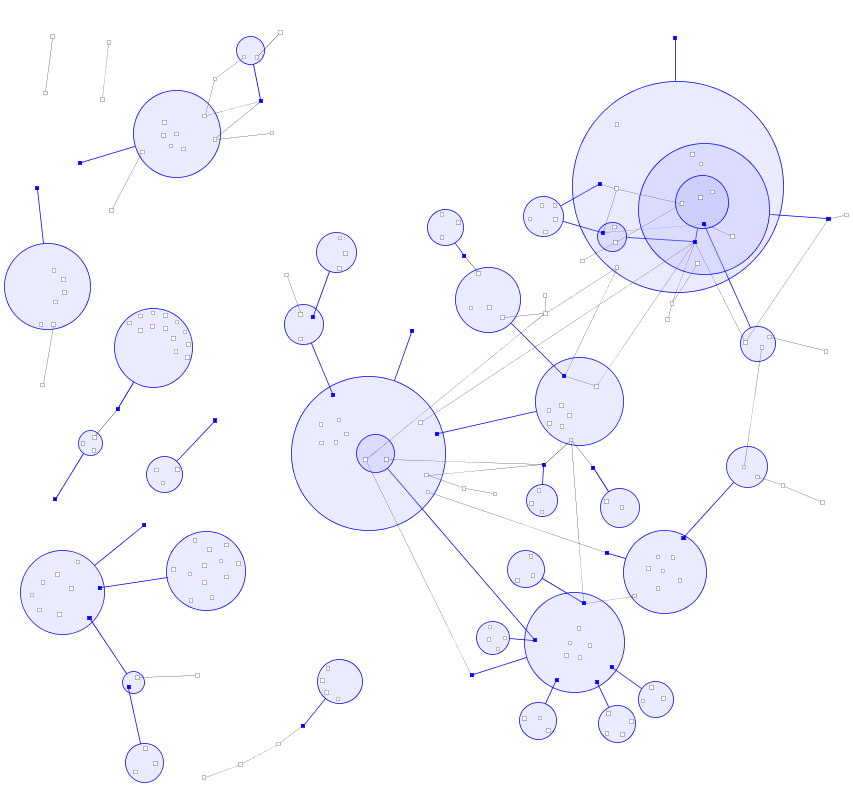
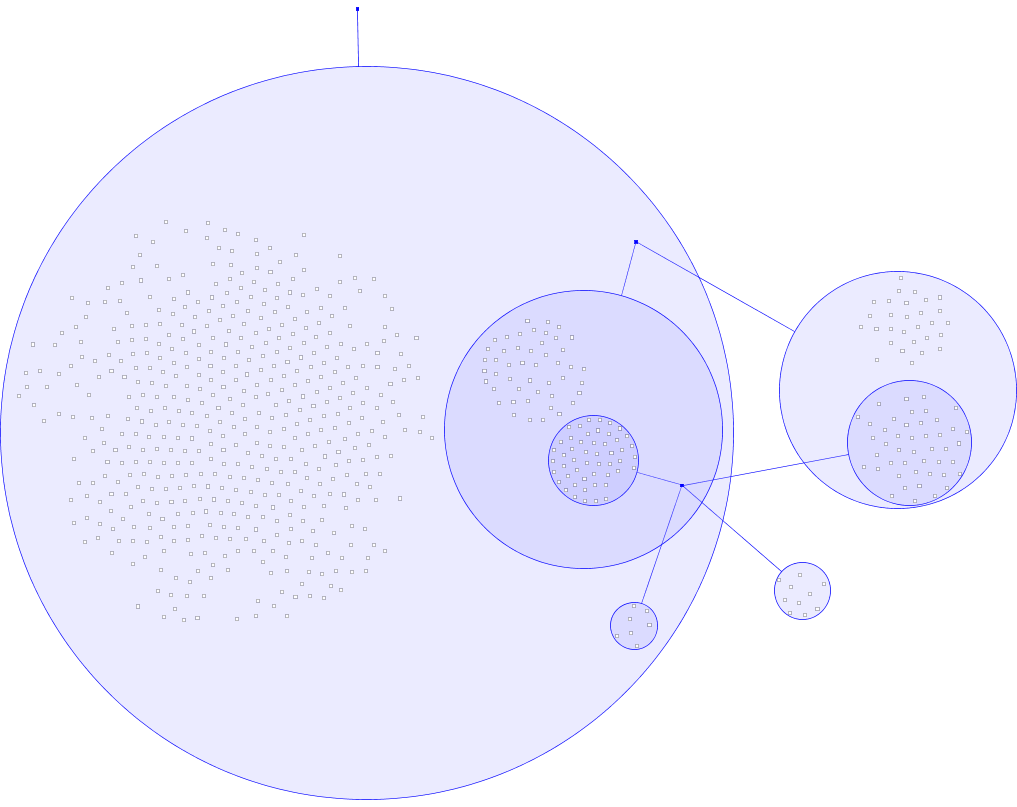
Our approach is based on two new symbols: power nodes and power edges. A power node stands for a set of nodes, and a power edge connects two sets of nodes and signifies that all nodes of the first set are connected to all nodes of the second set. Using these language primitives it is possible to succinctly represent two recurrent patterns in biological networks: cliques (complete graph) and bicliques (complete bipartite graph). As shown in the following figure, a biclique is represented as two power nodes connected by a power edge, whereas a clique is a power node connected to itself by a power edge. In the first case the power graph representation reduces the number of edges from 70 edges to one power edge, in the second case from 21 edges to one power edge.

Power nodes are visualized by discs delineated by a circle, they are interpreted as usual Euler diagrams on sets of nodes. Euler diagrams use circles to represent sets, with the position and overlap of the circles indicating the relationships between the sets. Power edges are represented as segments connecting the circles that delineate the power nodes. Moreover no circles intersect. Reflexive edges are allowed in power graphs, they are represented using a loop edge.
Visualization Examples
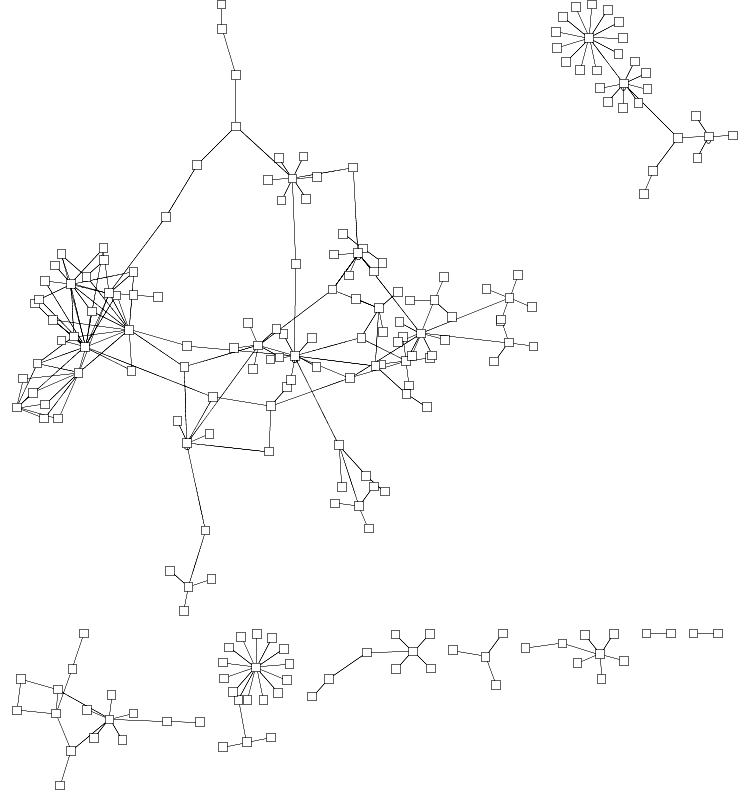
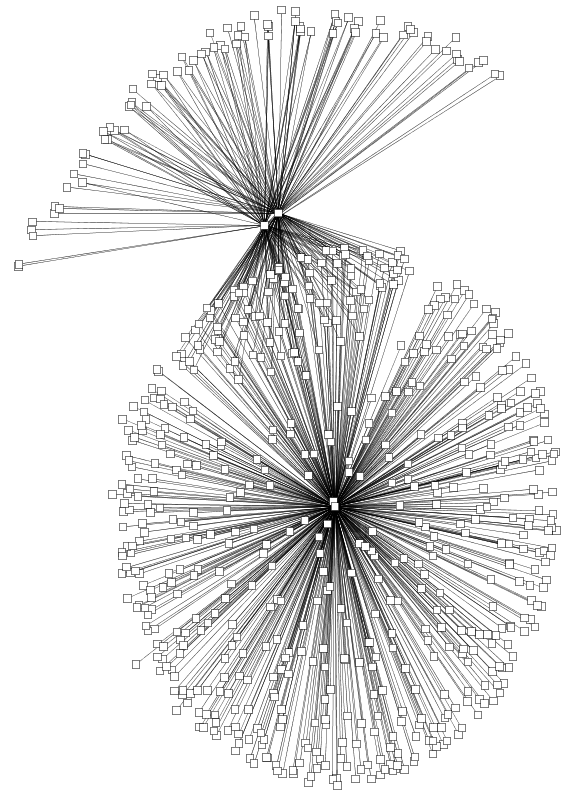
In most visualisations of compexe networks, and in particular for protein interaction networks, the great number of egdes and edge crossings is the main hindrance for the typical cognitive tasks required for understanding these networks. These tasks are for example determining the neighboors of a node, the possible paths between two nodes, and the existence of cliques and bicliques within the networks. Power Graph Visualization is a lossless method for representing graphs that acheives greater clarity through the reduction in the number of edges needed to represent the networks.
|
Example 1 | ||
 |
 |
|
| High resolution image | High resolution image | |
|
Example 1 | ||
 |
 |
|
| High resolution image | High resolution image | |
|
Example 1 | ||
 |
 |
|
| High resolution image | High resolution image | |
|
Example 4 | ||
 |
 |
|
| High resolution image | High resolution image | |
|
Example 2 | ||
 |
 |
|
| High resolution image | High resolution image | |
 |
 |
|
| High resolution image | High resolution image | |
Results
We have evaluated the approach on databases such as DIP, HPRD, BioGrid, and Intact covering various experimental methods and species. We achieve an edge reduction of up to 82%. Besides an improved visualization of the networks, the method reveals the networks’ underlying structure arising from domain-domain interactions, covering complexes, and re-occuring network motifs.
References
[1] IntAct Project from European Bioinformatics Institute
