BioSysBio:abstracts/2007/Joanna Sharman
MaGnET: a software tool for integrated visualisation of functional genomic data relating to the malaria parasite
Author(s): Joanna L. Sharman and Dietlind L. Gerloff
Affiliations: Biocomputing Research Unit, Insitute of Structural and Molecular Biology, University of Edinburgh, Edinburgh, UK
Contact: J.L.Sharman@sms.ed.ac.uk
Keywords: 'malaria' 'functional genomics' 'visualisation' 'data integration'
Background/Introduction
With the emergence of varied types of functional genomic data comes a need for effective tools that allow biologists (and bioinformaticians) to explore these data. The goal of exploration/browsing-style analyses will typically be to derive clues towards the function of thus far uncharacterised gene products, and to formulate experimentally testable hypotheses. Graphic interfaces to individual data sets (e.g. genome browsers) are obviously beneficial in this endeavour. However, effective visual data exploration requires also that interfaces to different functional genomic data are integrated and that the user can carry forward a selected group of genes (not merely one at a time) across a variety of data sets. Non-expert users especially benefit from workbench-like tools offering access to the data in this way. Still, only very few of the contemporary publicly available software seem to have implemented such functionality.
Previous work in our group has yielded an integrated visualisation tool for the model organism Saccharomyces cerevisiae [1]. YETI (Yeast Exploration Tool Integrator) is a prototype light-weight JAVA application and was motivated by the observation that selective visualization can often alleviate the sensation of “data overload” that is commonly experienced by scientists seeking to derive new hypotheses from functional genomic data. Here we present a similar development for the malaria-causing parasite Plasmodium falciparum: the Malaria Genome Exploration Tool (MaGnET).
Results
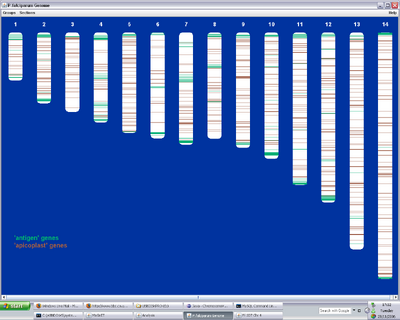
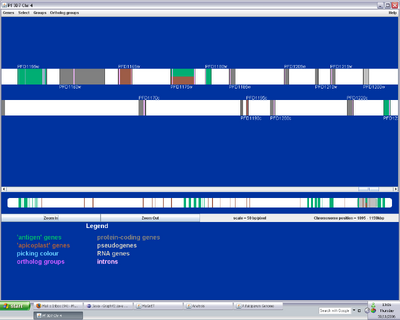
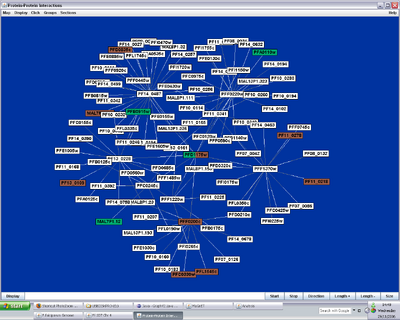
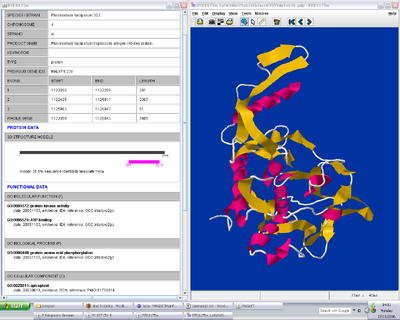
MaGnET consists of a JAVA program for visualisation with a MySQL database for data storage. Currently implemented visualisation sections are: a Genome section displaying chromosomal location of predicted ORFs and genomic features; a Proteome section for viewing protein-protein interaction data and protein 3-D structures; an Analysis section providing an interface to the database, facilitating keyword searches and allowing complex queries. A Transcriptome section for viewing gene expression is under development. Emphasis has been placed on only incorporating data into MaGnET that is expected to be at least of reasonable quality. For example, the careful filtering of comparative models allows us to include predicted protein structures alongside the few experimental structures that are currently known.
The existence of YETI has facilitated the design and implementation of the MaGnET program. However, the single-organism focus of these tools required careful consideration of the specific needs of each user community and the differences in availability of functional genomic data for P. falciparum compared with yeast. For example, P. falciparum genome annotation remains scarce, which is reflected in the paucity of GO (Gene Ontology) categories assigned to the genes.
Data Sources
- Chromosome/gene annotation and GO (Gene Ontology) [2].
- Experimental protein structures and comparative structural models [3].
- Protein-protein interactions (large-scale yeast 2-hybrid study) [4].
Screenshots
Figure 1. MaGnET screenshots: Top left: Genome view showing the distribution of two groups of genes ('antigen' genes, green, and 'apicoplast' genes, brown); Top right: Chromosome viewer showing a portion of the two strands, genes are coloured as before with unselected genes in grey and introns in pink; Bottom left: Protein-protein interaction visualisation; Bottom right: Gene factsheets list genomic and proteomic data (left), including links to any 3-D protein structures, which open in the Jmol viewer (right).
References
- YETI: Orton et al. (2004) Bioinformatics, 20. (http://www.yetibio.com)
- PlasmoDB: Bahl et al. (2003) Nucleic Acids Research, 31. (http://www.plasmodb.org)
- ModBase: Pieper et al. (2004) Nucleic Acids Research, 32. (http://modbase.compbio.ucsf.edu/)
- Protein-protein interactions: LaCount et al. (2005) Nature, 438.


