BioSysBio:abstracts/2007/Jan Kuentzer
Abstract analysis of pathways using the BN++ software framework
Author(s): Jan Küntzer1, Benny Kneissl1, Oliver Kohlbacher2, Hans-Peter Lenhof1
Affiliations: 1Center for Bioinformatics, Saarland University, 66041 Saarbrücken, Germany;
2Center for Bioinformatics/Wilhelm Schickard Institute for Computer Science, Eberhard-Karls-Universität Tübingen, 72076 Tübingen, Germany
Contact:email: kuentzer at bioinf uni-sb de
Keywords: 'systems biology' 'pathway analysis' 'software framework' 'biochemical network'
Introduction
Technological advances in high-throughput techniques and efficient data acquisition methods have resulted in a vast amount of life science data, including pathway information such as metabolic and regulatory pathways. The rapid increase of these pathway data for various organisms offers the possibility to perform analyses on the networks for single organisms (intra-species) as well as across different organisms (inter-species). However, the sheer amount and heterogeneity of the data models pose a major challenge and call for an integrative system, allowing to manage all this information. With BN++, especially its C++ framework, we presented such a system [2]. In contrast to various databases (e.g. KEGG, Reactome, IntAct, ...), which offer only predefined analyses such as minimal connected component or pathway detection from a start to an end compound, the mathematical graph representation in BN++ allows additionally the implementation of own routines.
The analysis of biochemical pathway information has different applications, e.g. in the process of target identification, drug design and in the search for causes of genetic diseases. Therefore, nodes or edges are removed and alternative pathways in an organism needs to be identified.
In basic research these networks can be used for the comparison of metabolic processes of different organisms. For example the information on the metabolism of one organism can be used to understand the newly sequenced genome (and, correspondingly, the metabolic pathways) of another organism as presented in [1] using PathFinder.
Background
To understand the mathematical graph representation, we first need to define some concepts:
We define [math]\displaystyle{ G(V,E) }[/math] to be a mathematical graph, where [math]\displaystyle{ V }[/math] denotes a finite set of nodes of [math]\displaystyle{ G }[/math] and [math]\displaystyle{ E = (V x V) }[/math] denotes a set of pairs of nodes, called the edges of the [math]\displaystyle{ G }[/math].
A graph [math]\displaystyle{ G(V,E) }[/math] is defined as bipartite, iff [math]\displaystyle{ V = V_1\cup V_2 }[/math] can be partitioned into two sets [math]\displaystyle{ V_1 }[/math] and [math]\displaystyle{ V_2 }[/math] such that [math]\displaystyle{ V_1\cap V_2 = \emptyset }[/math] and [math]\displaystyle{ (u,v)\in E = ((V_1\times V_2)\cup (V_2\times V_1)) }[/math] implies either [math]\displaystyle{ u\in V_1 }[/math] and [math]\displaystyle{ v\in V_2 }[/math], or [math]\displaystyle{ u\in V_2 }[/math] and [math]\displaystyle{ v\in V_1. }[/math]
The modeling of a biochemical pathway as a mathematical graph can be done in different ways, differing in the interpretation of the nodes and edges. Hence, various data models have been developed over the last years. The mostly used models are presented in [3]. We will define three different models in the following:
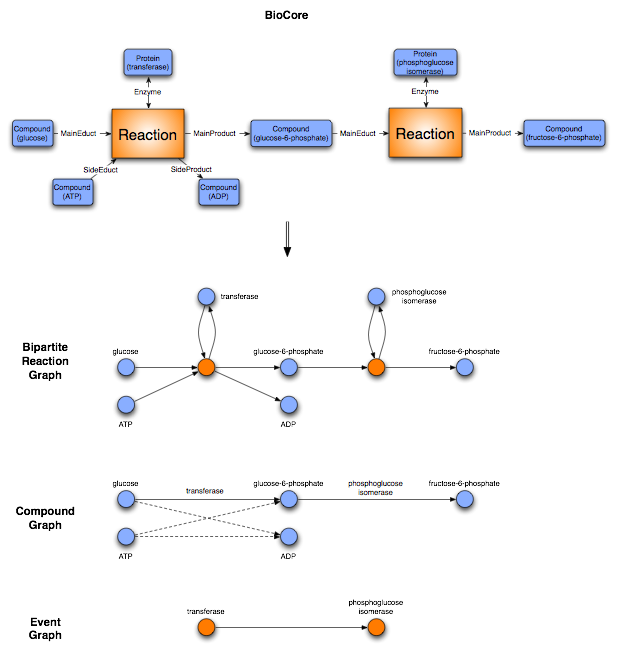
We define a bipartite reaction graph to be a bipartite graph, where [math]\displaystyle{ V_1 }[/math] contains all events and [math]\displaystyle{ V_2 }[/math] all compounds. A node A is connected with a directed edge to node B, iff compound A plays the role of an educt in Event B or if compound B plays the role of a product in Event A.
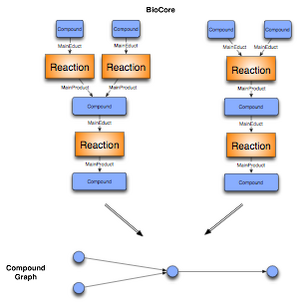
We define a compound graph to be a mathematical graph, where the nodes are the chemical compounds. A is connected with a directed edge to B, iff compound A plays the role of an educt and compound B plays the role of a product in the same Event.
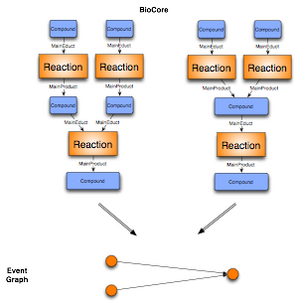
We define an event graph to be a mathematical graph, where the nodes are the events. A node A is connected with a directed edge to B, iff a compound Y plays the role of an educt in the event A and the role of a product in the event B.
Results
The biochemical network library BN++ is designed as a powerful software package for integrating, analyzing, and visualizing biochemical data in the context of networks. The heart of BN++ is built by the comprehensive object-oriented data model BioCore, which allows to model most of the currently known biochemical processes like metabolic and regulatory pathways. The main concept of BioCore is based on three central classes Event, Role, and Participant. Biochemical processes are modeled as Events with different Participants playing a certain Role. Currently BioCore contains a huge number of predefined Event classes (Reaction, Interaction, Expression, ...), Participant classes (Protein, Gene, DNA, RNA, Compound, ...), and Role classes (Maineduct, Sideeduct, Enzyme, Activator, Inhibitor, ...). If necessary BioCore can be easily extended by subclassing from the core classes to model new biochemical knowledge.
Numerous databases with different data models and structures have been established around the world. BN++ contains import capabilities for a large number of different external data sources (KEGG, BioCyc, TransPath, DIP, MINT, IntAct, HPRD, ...), which can be stored in the data warehouse of the biochemical network library.
The C++ framework allows to create a mathematical graph representation for the analysis of complex biochemical data in the context of networks. As shown in the section above, there is no unique mapping of biochemical networks onto a single graph structure. We thus provide different generic mappings, that enables us to map arbitrary BioCore classes onto the nodes and edges of a graph. We integrated an event graph, a compound graph, as well as a bipartite reaction graph representation of the data into the framework. The edges for enzymatic reactions in the compound graph representation are optionally labelled with the enzyme catalyzing the event. In addition the compound graph is only built out of the Mainproducts and Maineducts in the reaction. All the graphs can be automatically generated from the BN++ data warehouse or the BioCore data model by one single line of code.

The bipartite reaction graph is a one-to-one mapping of the object-oriented data model BioCore. The event and participant classes are mapped onto nodes. The edges are defined by the roles the participants play in a certain event. An example is given above (Figure 1). The representation doesn't contain any ambiguity, however it consists of two kinds of nodes, event and participant nodes. For different analyses this kind of representation is not applicable. Therefore, the biochemical network library allows to represent the data as a compound graph or its dual form, an event graph. Both graph representation simplify the network, thus contain some ambiguity which make them inapplicable in some situations. Depending on the kind of analysis a user can decide which kind of graph representation is suitable for the application.


The internal implementation of the graph data structure is based on the Boost Graph Library (BGL). BGL also provides a number of graph algorithms like shortest paths, minimum spanning trees, connected components, etc. Furthermore, we integrated new algorithms like the k-shortest path algorithm.
The rapid prototyping library BN++ allows to focus on the analysis without the need to deal with an implementation of the import of external data nor with an implementation of a graph representation.
In the following section we will show the power and the ease-of-use of the BN++ software framework. Therefore, we present an pathway similarity algorithm on the basis of the algorithm introduced by Pinter et al. [4].
Pathway Similarity Algorithm
The algorithm should find for a given pathway P (pattern) all similar pathways in a biochemical network T (text). The similarity between the participants of the pattern and the text are defined by a scoring matrix. Furthermore, the pathways should be ranked by a similarity score.
To solve the problem we use the BN++ software framework and the possibility to automatically create a mathematical graph. We chose the compound graph representation for the pathway and the network. Additionally, the edges are labeled with the enzymes catalyzing the reaction. Finding similar pathways means to solve subgraph homeomorphism and isomorphism problems. However, solving such problems is NP-complete, such that we can not solve them in polynomial time. We thus reduce the graph structure into a tree structure allowing to implement an algorithm in polynomial time. However, this also means that we are not able to analyze pathways containing circles whithout destroying the loop. For the conversion of the graphs into a tree structure we use a breadth first search (BFS) algorithm with different root vertices which results in more than one tree.
We define the similarity of a pattern P and a subtree of a text T as the combination of a vertex comparison score, the tree topology and in some cases an additional edge comparison score. Taking the topology into account means that we consider the direction of the edges and map only inedges on inedges and outedges on outedges. Thus we only map those nodes on each other where the number of inedges (outedges) of the pattern vertex are smaller or equal to the number of inedges (outedges) of the text vertex since vertex deletions are only allowed in the text. In addition to the topology we consider the similarity of the mapped edges and vertices too. The similarity scores of the nodes can be defined by the user with a scoring matrix. In the case of metabolic pathways, where the edges are labelled with the enzymes catalyzing the reaction, we also consider the edge similarity. Therefore we provide a simple scoring function for enzyme similarity based on the hierarchical scheme of the EC numbers.
The computation of the alignment score given a pattern P and a text T is done recursively in a postorder traversal of the trees. For every entry of the alignment matrix we take the maximum of two values:
[math]\displaystyle{ al\_mat[u,v] = \max\{\delta[u,v] + MS(G_{C(u,v)}), BestChild(u,C_v) + gap\_pen\} }[/math]
where [math]\displaystyle{ \delta[u,v] }[/math] is the corresponding value of the scoring matrix, [math]\displaystyle{ MS(G_{C(u,v)}) }[/math] is the maximum matching value of the children of the current vertices [math]\displaystyle{ u }[/math] and [math]\displaystyle{ v }[/math] and [math]\displaystyle{ BestChild(u,C_v) }[/math] is the maximum value of the alignment matrix of [math]\displaystyle{ u }[/math] and a child of [math]\displaystyle{ v }[/math]. We initialize the values [math]\displaystyle{ BestChild(u, C_v) }[/math] with [math]\displaystyle{ -\infty }[/math] and [math]\displaystyle{ MS(G_{C(u,v)}) }[/math] with 0.
Since we compute the alignment score in a postorder traversal of the tree the values [math]\displaystyle{ BestChild(u, C_v) }[/math] are calculated before. The only value, which has to be computed in every step, is the maximum matching score [math]\displaystyle{ MS(G_{C(u,v)}) }[/math] of the children of [math]\displaystyle{ u }[/math] and [math]\displaystyle{ v }[/math]. We therefore take the Hungarian Method.
<html><embed src="http://fred.bioinf.uni-sb.de/kuentzer/biosysbio/pathwaySimilarity.mov" autostart="false" width="320" height="240" controller="true" autoplay="false" loop="false">
The movies shows for an example all steps of the Hungarian Method.
</html>
Conclusion
With the Biochemical Network Library BN++ we present a rapid prototyping library, which offers the possibility to analyze complex data in the context of biological networks with little effort. BN++ provides an interface for a large number of external data sources allowing to combine the data from various data models with one single library. The rich functionality of different graph representations gives the possibility to chose a suitable representation for a given application. The library offers a huge variety of different standard routines like single-source-shortest-path, minimum-spanning-tree, strongly-connected-components, etc. These routines can be used to implement own applications as shown in the section above. All the functionality can be easily used by mostly one single line of code using the rapid prototyping capability of BN++. With BN++ a user can focus on his application. The internal graph implementation using the BGL is generic, in the same sense as the Standard Template Library (STL). This results in a high performance and robustness of the system.
Acknowledgements
We would like to thank the DFG and the Klaus-Tschira-Foundation for funding the project.
References
[1] M. Sirava, T. Schäfer, M. Eiglsperger, M. Kaufmann, O. Kohlbacher, E. Bornberg-Bauer, H.P. Lenhof (2002). BioMiner - modeling, analysing, and visualizing biochemical p athways and networks. Bioinformatics, 19(10), 219-230.
[2] J. Küntzer, A. Gerasch, C. Backes, A. Hildebrandt, M. Kaufmann, O. Kohlbacher,H.P. Lenhof (2006). BN++ - A Biological Information System. Journal of Integrative Bioinformatics, 3(2): 34.
[3] Y. Deville, D. Gilbert, J. van Helden, S.J. Wodak (2003). An overview of data models for the analysis of biochemical pathways. Briefings in Bioinformatics, 4(3):246-259.
[4] R. Pinter, O. Rokhlenko, E. Yeger-Lotem, M. Ziv-Ukelson (2005). Alignment of metabolic pathways. Bioinformatics, 21(16):3401-3408.