BME103:T930 Group 9
| Home People Lab Write-Up 1 Lab Write-Up 2 Lab Write-Up 3 Course Logistics For Instructors Photos Wiki Editing Help | |||||||||||||||||||||||||||||||||||||||||||||||||||||||||||||||||||||||||||||||||||||||||||||||||||||||||||||||||||||||||||||||||
OUR TEAMLAB 1 WRITE-UPInitial Machine TestingThe Original Design
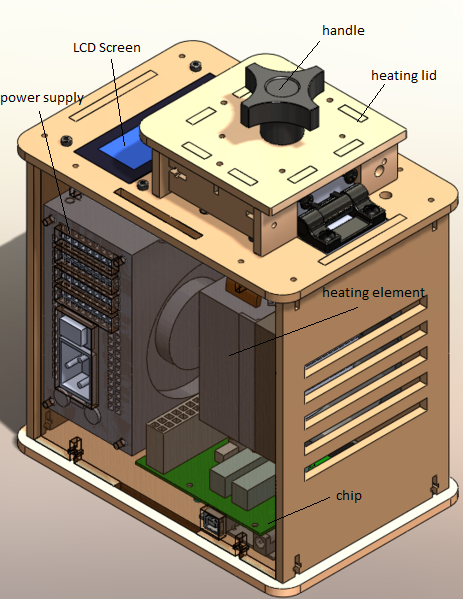
When we unplugged part 3, the LCD, from part 6, the Open PCR circuit Board, the LCD on the machine turned off and no information appeared on the LCD screen.
Test Run On October 25, 2012, we conducted our first test on our open PCR machine. We tested the machine to test the operation functionality. The initial test demonstrated the machine heat sink accurately controlled and displayed the preprogrammed temperature determined by the software on the computer. The overall successfullness of the machine was good, however it came with one difficulty, fluctuation of time to complete the preprogrammed cycles.
ProtocolsPolymerase Chain Reaction
Source: [1]
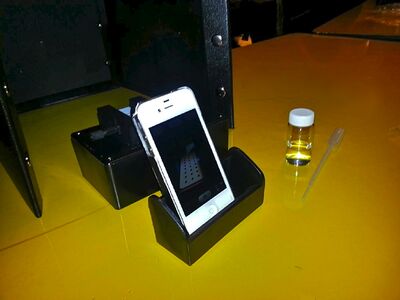
Flourimeter Assembly Procedure
How to Open Pictures Using Image J
How to Analyze Pictures in Image J
ImageJ Software Processing Measurements
| |||||||||||||||||||||||||||||||||||||||||||||||||||||||||||||||||||||||||||||||||||||||||||||||||||||||||||||||||||||||||||||||||
Research and Development
Specific Cancer Marker Detection - The Underlying Technology
After studying how the polymerase chain reaction machine works and the results it yields, we have to study how the DNA processed can be used to identify any sort of disease. Specifically, the rs17879961 cancer-associated sequence will produce a DNA signal because of the single nucleotide variation in its gene code. Based on our study of the rs17879961 cancer-associated sequence, we found that the missense mutation in e gene code yields a positive identification marker for cancer when the a single nucleotide C changes to a single nucleotide T.
Original Code:
GGAAGTGGGTCCTAAAAACTCTTACA[C]TGCATACATAGAAGATCACAGTGGC
Modified Code: (due to SNP)
GGAAGTGGGTCCTAAAAACTCTTACA[T]TGCATACATAGAAGATCACAGTGGC
When considering scientific detection of the missense mutation itself, we have found that our DNA sequence rs17879961 is related to the condition of Breast and Colorectal Cancer. Therefore, in the case of PCR detection, the sequence for rs17879961 would be copied for by a primer. The primer starts the copying going forward and backward, with the primer that correlate to the strand of DNA; this primer identify the cancer sequence out of the DNA. Then, the patient would have that strand of DNA extracted and prepared for PCR amplification process. This preparation would include the use of primers, taq Polymerase, solution and dNTPs, and other necessary materials. This solution would be inserted into the PCR machine to be heated/cooled/heated. Eventually, the PCR process would yield multiple strands of the DNA that was initially placed and the SNP part that we had identified. A non-cancer DNA sequence would not produce a signal because the nucleotide variation where a primer would replicate DNA would be out of place; therefore, its process of DNA amplification would occur as normal. Only when we have a mutation, can we identify a signal from the DNA (assuming that we are attempting to detect a normal nucleotide sequence).
As mentioned previously, we studied that the cancer marker, rs17879961, in the PCR experiment was correlated to the Breast and Colorectal cancer, but to completely understand the extent of this cancer's SNP to the development of cancer, we need to take a look at the statistics that not only follow Baye's Rule, but also provide useful information about the spread of this type of cancer. Bayesian reasoning accounts for the prevalence, sensitivity, specificity and false positive rates of a disease in order to further understand that disease. Sensitivity is the likelihood that a person afflicted with the disease will test positive for it, while specificity is the likelihood that a person without the disease will test negative for it. Based on conditional probabilities from a population diversity in Finland where the tested sample was 180 people, we found that the frequency of this cancer found in Finland was 7.8%. The genotype of this sequence of C/T in this population was 1.1% and the genotype of T/T was found to be 98.9%.
For more infomation, visit http://www.ncbi.nlm.nih.gov/projects/SNP/snp_ref.cgi?rs=17879961.
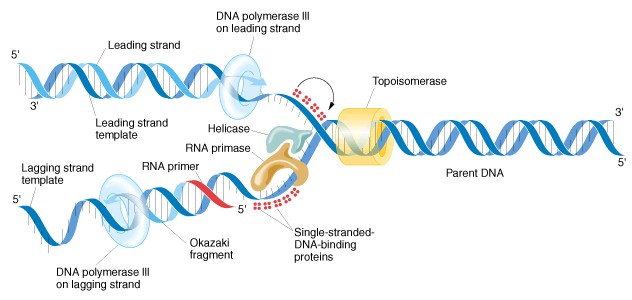
Source: [2]
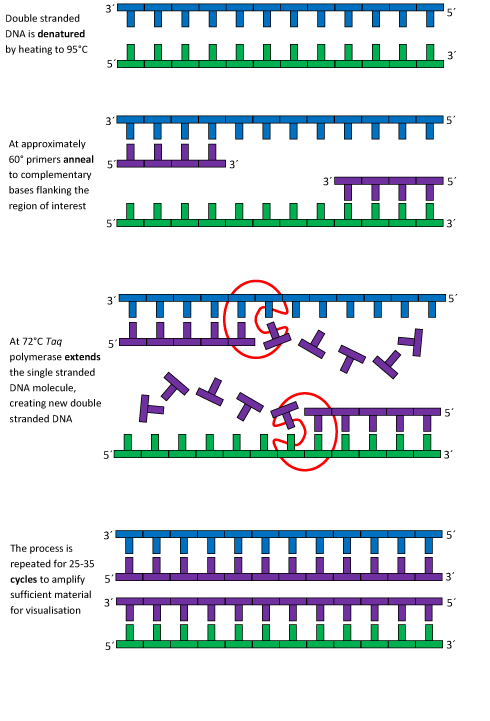
Source: [3]
For more information on the PCR DNA replication process, please visit this website: http://learn.genetics.utah.edu/content/labs/pcr/.
Results
Positive Test
Negative Test

The Patient Information
| Patient Identification Number | Gender | Age |
|---|---|---|
| 31542 | Male | 55 |
| 52125 | Female | 55 |
| Sample | Integrated Density | DNA μg/mL | Conclusion |
| PCR: Negative Control | 138082.756 | 0.49 | NEG - Water |
| PCR: Positive Control | 214199.614 | 1.54 | POS - Calf Thymus |
| PCR: Patient 1 ID 31542, rep 1 | 377121.108 | 2.70 | POS |
| PCR: Patient 1 ID 31542, rep 2 | 311547.192 | 2.23 | POS |
| PCR: Patient 1 ID 31542, rep 3 | 278870.460 | 1.00 | NEG |
| PCR: Patient 2 ID 52125, rep 1 | 253204.641 | 1.82 | POS |
| PCR: Patient 2 ID 52125, rep 2 | 180120.594 | 1.29 | NEG |
| PCR: Patient 2 ID 52125, rep 3 | 606603.192 | 4.35 | POS |
KEY
- Sample = The sample is the substance tested using the flourimeter, in the case of this lab the substances used are a positive control, negative control, 3 trials for patient one, and 3 trials for patient 2.
- Integrated Density = Integrated density is the sum of the pixels in a given are, this is found by finding the product of the area and mean pixel value then subtracting the background.
- DNA μg/mL = This is the concentration of DNA in the respective sample, this is calculated by multiplying the integrated density by 2 and dividing by the integrated density value of calf thymus.
- Conclusion = A positive signal represents a sample that exhibited the same reaction to sybr green in the lab as our positive control; a negative signal represents a sample that exhibited the same reaction to sybr green as the negative control.


