BME100 s2014:T Group11 L5
OUR TEAM
 |
 |
 |
 |
 |
Background Information
SYBR Green 1 Dye: The SYBR green 1 dye is a light sensitive liquid that when added to DNA emits a green light and absorbs blue light.
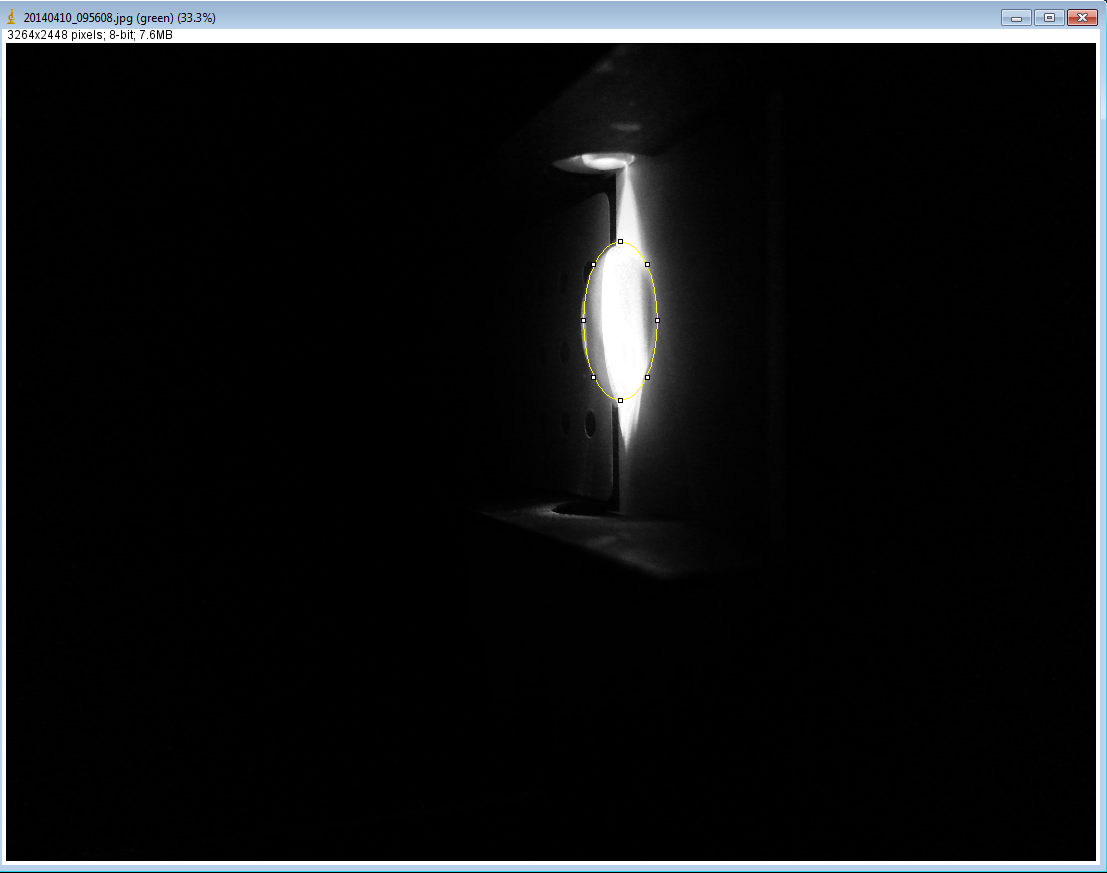
Single-Drop Fluorimeter: The fluorimeter consists of a plastic box with a channel for inserting microscope slides. A switch on the side activates the blue LED that shines through the drop being analyzed.
Fluorescence Technique: This technique is done by combining the SYBR Green Dye with the PCR Samples on the microscope slide. Then a blue light beam is shined through the drop and the dye will emit a different amount of green to
Procedure
Camera Used: Samsung Galaxy S3
Camera Settings:
                ISO: 800
                White Balance: Auto
                Exposure: High
                Saturation: High
                Contrast: Low
Calibration and Solutions Used:
Distance between camera and drop: 6.5 cm
| Initial Concentration of 2X Calf Thymus DNA solution (µg /mL) | Volume of the 2X DNA solution (µL) | Volume of the SYBR GREEN I Dye solution (µL) | Final DNA concentration in SYBR Green I solution (µg/mL) |
| 5 | 80 | 80 | 2.5 |
| 2 | 80 | 80 | 1 |
| 1 | 80 | 80 | 0.5 |
| 0.5 | 80 | 80 | 0.25 |
| 0.25 | 80 | 80 | 0.125 |
| 0 | 80 | 80 | 0 |
Placing Samples:
1. micropipette 80 µL of SYBR Green I onto the slide in the middle of the first two rows
2. micropipette 80 µL of Calf Thymus DNA solution into the SYBR Green I
3. move the slide to align the drop with the blue LED
Data Analysis
| PCR Product TUBE LABEL | Volume of the DILUTED PCR Product solution (µL) | Volume of the SYBR GREEN I Dye solution (µL) | INTDENS VALUES BASED ON 3 SEPARATE DROP MEASUREMENTS | ' | ' | AVERAGE INTDENS VALUE |
| PCD (30337) | 80 | 80 | 5947701 | 6168373 | 6168373 | 6094816 |
| P11 | 80 | 80 | 1801358 | 1548272 | 1548272 | 1632634 |
| P12 | 80 | 80 | 1517215 | 1111331 | 1340538 | 1323028 |
| P13 | 80 | 80 | 1642188 | 1104759 | 1095043 | 1280663 |
| PCN (57707) | 80 | 80 | 1740195 | 1944156 | 1560480 | 1748277 |
| P21 | 80 | 80 | 2689350 | 1742994 | 1264839 | 1899061 |
| P22 | 80 | 80 | 1642865 | 1407526 | 1001890 | 1350760 |
| P23 | 80 | 80 | 1028169 | 1085183 | 941678 | 1018343 |
| PCR Product TUBE LABEL | AVERAGE INTDENS VALUE | PCR Product Concentration, µg /mL | Corrected PCR Product Concentration, µg /mL |
| PCD (30337) | 6094816 | 0.568964 | 0.047414 |
| P11 | 1632634 | 0.122746 | 0.010229 |
| P12 | 1323028 | 0.091786 | 0.007649 |
| P13 | 1280663 | 0.087549 | 0.007296 |
| PCN (57707) | 1748277 | 0.13431 | 0.011193 |
| P21 | 1899061 | 0.149389 | 0.012449 |
| P22 | 1350760 | 0.094559 | 0.00788 |
| P23 | 1018343 | 0.061317 | 0.00511 |
PCR Results Summary
Instructor's summary: You completed 8 PCR reactions in a previous lab. You used the SYBR Green I staining and imaging technique to measure the amount of amplified DNA in each PCR reaction. You used a standard curve (based on known concentrations of calf thymus DNA) to convert INTDEN values into DNA concentration. Your positive control and negative control samples should be used as threshold values for determining whether an unknown (patient) sample is truly positive or negative. Your positive control PCR result was ____ μg/mL Your negative control PCR result was ____ μg/mL
Write-in each patient ID and give both a qualitative (what the images looked like) and a quantitative description (μg/mL) of what you observed Patient _____ : Patient _____ : Compare each patient's results to the positive control value and the negative control value. Draw a final conclusion for each patient (positive or negative) and explain why you made that conclusion. Patient _____ : Patient _____ :
