BME100 f2018:Group9 T0800 L6
| Home People Lab Write-Up 1 | Lab Write-Up 2 | Lab Write-Up 3 Lab Write-Up 4 | Lab Write-Up 5 | Lab Write-Up 6 Course Logistics For Instructors Photos Wiki Editing Help | |
OUR TEAM
LAB 6 WRITE-UPBayesian StatisticsOverview of the Original Diagnosis System In this lab, 15 teams of students with five to six members each tested patient samples for Parkinson's disease. Each team was assigned two patients to test for the disease with three samples of each patient’s DNA to reduce chances of error. The DNA samples were analyzed in a fluorescence lab, which used solutions of molecules that produced a dull green glow when reacting with DNA under a concentrated beam of light. Several known concentrations were added into ImageJ to calculate an equation that showed the concentration of the DNA based off the RawIntden-Background. This equation was then used to calculate the concentration of DNA in the patient samples to determine whether they tested positive or negative for the disease.Each patient’s results were recorded in three different photos as to best eliminate outliers in the ImageJ analysis. Each team submitted eight photos total from the ImageJ analysis, consisting of one positive control, one negative control, three samples from each patient and the team’s final conclusion based on each patient’s results. The data were published in a spreadsheet for a total of 90 imaging results and positive/negative interpretations. Within the spreadsheet, he class assumed 30 positive results, 44 negative results and 16 inconclusive PCR results. A few teams had trouble collecting data from their lab results, inducing 3 inconclusive analysis in the class’s 30 conclusions. Most of the remaining data assumed negative results, 16 in total against 11 positive results.
For the detection of the diseased SNP in the two patients, 3 replicate samples were run through the PCR diagnostic test. The results from the test were run through Bayesian statistics to determine the reliability from the results of our PCR diagnosis. The results were found to be reliable with sensitivity of diseased SNP detection(probability a positive final conclusion would be arrived given a positive PCR reaction) and specificity of disease SNP detection(probability a negative final conclusion would be arrived given a negative PCR reaction) are both near 100%. The results imply that PCR is highly specific but not sensitive for predicting the development of the disease in DNA. The Bayes value for sensitivity was below 35% and the value for specificity was almost 90%. This means PCR is good for only detecting the specific disease in the person's DNA but it will often falsely identify a patient who should be positive as negative or negative as a positive which occurred multiple time in the experiment. During the PCR and the detection steps in the lab, many human errors could have occurred. When the pipet was used, the amount of substance sucked up into the pipet, in some trials was not fully dispensed causing an off balance of the chemicals in the PCR tubes being analyzed. Which would lead to an inaccurate result in determining the amount of DNA concentration present in the patient being analyzed. With an inaccurate calculation of the DNA sample, the Bayes values of the total positive and negative conclusion would be inaccurate effecting the overall lab. Another error that occurred was the withdrawal of the SYBR Green from the tubes. This was a possible human error due to the SYBR Green needed to be covered with tinfoil from light in order to have the best effect. When withdrawing the SYBR Green, the amount of solution being pulled up into the pipet was hard to determine because the SYBR Green tube was covered with tinfoil making the amount of SYBR Green left in the tube unable to be determined. So when the tube was near empty, the students had no gauge on if the full amount of SYBR Green need for the experiment was being extracted. If the amount of SYBR Green extracted was off then the visual color of the DNA sample would not be easily detected. Overall altering the patients results. Leading to a misunderstanding in the calculations of the conclusions in the Bayes values of the lab. Finally, when working in the lab, the use of multiple solutions was occurring. The mix up of solutions when completing the lab is a very common human error that occurred. If the solutions were to be mislabeled or mixed up then the DNA results would be completely off, overall altering the diagnosis of the patient and bringing inaccuracy to the class average. This would affect the Bayes value in a negative way when attempting to calculate the overall positive and negative conclusions that occurred in the lab. Intro to Computer-Aided Design3D Modeling Our Design
Feature 1: ConsumablesA "Very Important" consumable in the scientific and marketing communities refers to a piece of non-reusable equipment in a set that can only be replaced by the same company that sells the component's main product. Any consumable component that is specialized for a certain task or is not molded to standard conditions fits under this definition as a "very important" consumable. Some consumables used in the fluorimeter kit included the tubes' PCR mix, primer solution, SYBR Green solution and plastic tubes fitting the PCR machine. Some very important consumables included the slides used in the flourimeter, which were designed to fit the plastic holder and retain the 160 ul. DNA droplets in place. Our new invention will not include any new very important consumables, which is good form the scientific communities perspective but not preferable from a marketing standpoint.
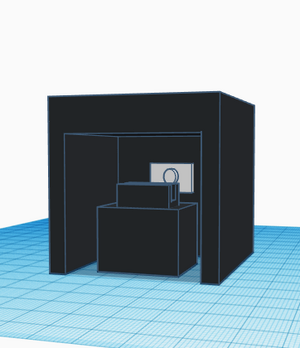
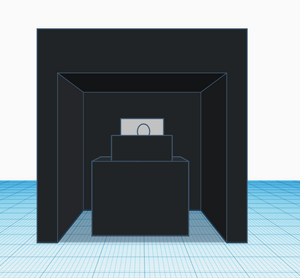
Feature 2: Hardware - PCR Machine & FluorimeterThe Open PCR machine would be the same design as the original. The open PCR machine would be used for the replication of DNA for the examination for the DNA in the fluorimeter system to determine which patient does or does not have the disease. The fluorimeter in our system is renovated by having a built in camera attached to the back wall of the black box which makes the capturing the picture of the droplet easy and more efficient. The major weakness our group had to deal with was with the fluorimeter, so our group took upon ourselves to redesign it. The challenge we had to deal with the fluorimeter was trying to set up the camera in order for it to be aligned with the slide containing the SYBR green and DNA mixture. We decided to add a built in camera onto the back side of the fluorimeter in order for it to be easier to set up. By making the camera already built in the fluorimeter, then it won't be as a struggle to line up with the slide. The built in camera onto the fluorimeter will make the fluorimeter only be able to open on one side, instead of both sides. In order for to camera take a proper picture of the DNA and SYBR green mixture it has to be aligned with the slide. The original height of the slide would be to short for our modified fluorimeter, so we have to make the slide taller. By making the height of the slide taller, then the camera will be perfectly aligned to the slide with the droplet making the capturing of picture of the mixture easier and more efficient.
| |


