BME100 f2018:Group8 T0800 L5
| Home People Lab Write-Up 1 | Lab Write-Up 2 | Lab Write-Up 3 Lab Write-Up 4 | Lab Write-Up 5 | Lab Write-Up 6 Course Logistics For Instructors Photos Wiki Editing Help | |||||||||||||||||||||||||||||||||||||||||||||||||||||||||||||||||||||||||||||||||||||||||||||||||||||||||||||||
OUR TEAM
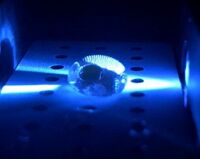
LAB 5 WRITE-UPPCR Reaction ReportIt was the team’s first time pipetting, thus, the pre-lab reading was very educational because the micropipetting videos showed how to use proper micropipetting technique to avoid mistakes and introduced the uses for the first and second stop of the pipette. It was decided that Katya and Karla were going to do the pipetting for the team. Thus, they gathered the materials which included the 8 tubes of PCR reaction mix, each with 50 μL of Taq DNA polymerase, MgCl2, and dNTP. Then, another 8 tubes had the DNA/primer mix, each with 50 μL of different templates of DNA but the same forward and reverse primers. Moreover, the 8 empty tubes in a rack. Lastly, the micropipette, box of fresh pipette tips, and the waste container. Karla began labeling the 8 empty tubes first starting with “G8 P”, followed by “G8 N”, “G8 1-1”, “G8 1-2”, “G8 1-3”, “G8 2-1”, “G8 2-2”, and “G8 2-3” for the last tube. As a result, we did not have to change our labeling scheme. Katya did the first half of pipetting, transferring the PCR reaction mix to the empty tube, then discarding the pipette tip. Then, taking the DNA/primer mix and transferring it in the correct labeled tube. The only difficulty at first was making sure all the liquid was obtained. Though, the other parts of pipetting such as going to the first stop, second stop and discarding the tips replaced with new ones was successful. Karla, then, did the last half of the tubes, making sure that each solution went to the correct tube, avoiding cross contamination. Likewise, she was successful of knowing when to use first and second stop, but it was just a bit difficult obtaining all the liquid from the tubes. When the tubes containing the DNA samples and PCR reaction mix were compared to each other, all had the same amount of liquid. In the other tubes, they were empty of any liquid that they had initially. Next, it was made sure that all the tubes were completely closed, ready for the next step. Dr. Garcia announced once groups were done pipetting, they were to bring their 8 tubes of solution to a PCR machine. He explained there that groups would have to share one machine, thus, our team was paired with another group. We placed our 8 tubes in the machine arranged in the first two rows (four per row). Then, the other group did the same in the last two rows. Once the top was shut, it was helpful that Dr. Haynes had provided instructions in the workbook on which to set the settings of the PCR machine. From there, we just waited one hour until the PCR machine was complete. Fluorimeter ProcedureImaging set-up Before placing the phone on the cradle, the settings on the camera had to be adjusted. Thus, both the exposure and saturation were set to the highest setting. Moreover, it was made sure that the contrast was set to the lowest setting and white balance set to auto. The timer was set to 3 seconds. Lastly, the most critical thing was to make sure the flash was turned off. After the settings on the camera were all set, the phone was placed vertically on the cradle and adjusted so that the the view on the phone is directly capturing the drop placed on the fluorimeter. It was adjusted by placing two trays under the fluorimeter to be in level with the camera. In addition, the phone was in level to capture the side of the drop and pressed to focus on the drop. It was made sure that when focusing, the phone was measured exactly 4.6 cm away from the fluorimeter to get a focused and close image of the drop.
Placing Samples onto the Fluorimeter
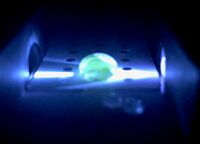
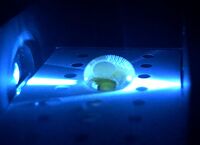
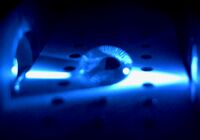
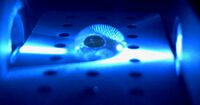
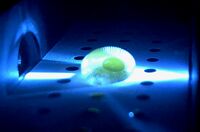
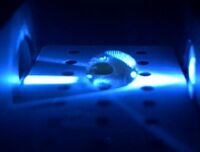
Data Collection and AnalysisImages of High, Low, and Zero Calf Thymus DNA Calibrator Mean Values
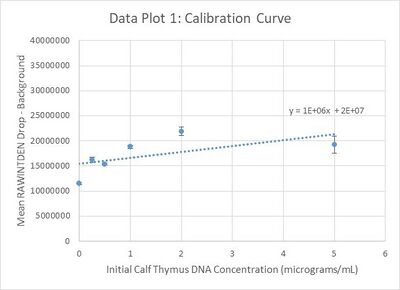
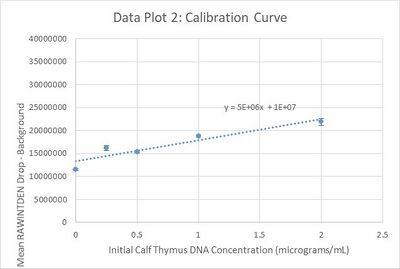
Calibration curves
Images of Our PCR Negative and Positive Controls
PCR Results: PCR concentrations solved
For patient 39480 the average of the three diluted PCR product concentrations was .03436 μg/mL. This means that the average initial PCR product concentration was 1.23688 μg/mL. These images show that the sample is positive because when the control image of the positive and this image are compared the sizing of both drops this image can be shown to be very similar.
Patient 81770 had an average diluted PCR value of 1.01523 μg/mL. Taking this number and the amount of dilutions into account the average initial PCR product concentration was 12.18279. This is further proven when the image is analyzed using pixel measurements.
Conclusions
This patient's value of 1.23688 puts it closer to the negative control than the positive control this leads our group to believe that this patient was negative.
Patient 81770 has a value of 12.18279 which means that its value lies between the positive and negative controls. This fact leads to inconclusive test results for this patient.
| |||||||||||||||||||||||||||||||||||||||||||||||||||||||||||||||||||||||||||||||||||||||||||||||||||||||||||||||


