BME100 f2018:Group7 T1030 L6
| Home People Lab Write-Up 1 | Lab Write-Up 2 | Lab Write-Up 3 Lab Write-Up 4 | Lab Write-Up 5 | Lab Write-Up 6 Course Logistics For Instructors Photos Wiki Editing Help | |
OUR COMPANYBIOtem LAB 6 WRITE-UPBayesian StatisticsOverview of the Original Diagnosis System There were 16 BME100 teams of about 4-5 student that diagnosed and submitted results for a total of 32 patients. Each group had two patients in which they diagnosed. To prevent error, there were three replicate PCR samples per sample. A positive and negative control was added to compare the values from the patients to the known control values. To prevent error in the ImageJ analysis, it was calibrated using calf thymus DNA to show a linear relationship between the concentration of DNA and mean RAWINTDEN drop - background. From the best fit line of the calibration, one can then calculate the initial PCR concentration and compare them with the controls--the very goal of the lab. Three images of each unique PCR sample was taken and measured with ImageJ to prevent error.
What Bayes Statistics Imply about This Diagnostic Approach Calculation 1 (sensitivity to detect the disease SNP) is very reliable in getting a positive final test conclusion given a positive PCR reaction. This is because the Bayes value is close to 1.00.
1. (Machine) Taking pictures that have minimal light interference.
2. (Human) Placing the sample drop correctly on the slides with the excitation/blue LED light directly through it.
3. (Machine/Human) Keeping the fluorimeter and camera at a correct and constant height.
Intro to Computer-Aided Design3D Modeling Our team decided to use SolidWorks to 3D model the improvement we made for the lab set up. Because all team members had used SolidWorks in the past, it was an obvious choice for us to use this program. In comparison to TinkerCAD, SolidWorks is more difficult to use. However, our experience using SolidWorks in BME 182 made us confident to use this more professional software for our design. In the end, it was a good choice because we could better model exactly what we wanted to create. Before we started using SolidWorks, we brainstormed ideas as a group. Then we sketched the drawing on paper and labeled all the necessary dimensions. From there, we were ready to make the 3D model in SolidWorks.
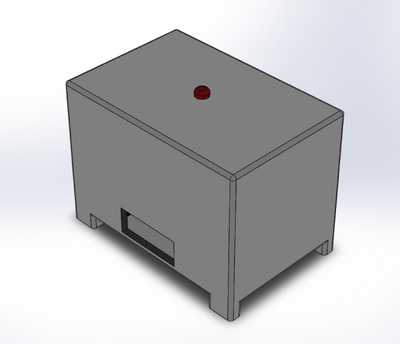
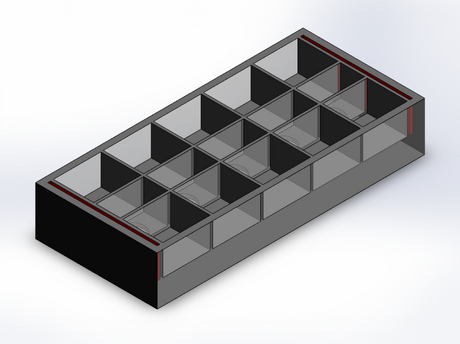
We decided to focus on the fluorimeter aspect of the lab and create fluorimeter with a built-in camera. The built-in camera is linked to a computer via a wireless signal or through USB so the imageJ analysis portion will be easier to utilize. When doing the lab ourselves, we noticed that it was difficult to have the phone and fluorimeter cradle consistent and steady between samples. The fluorimeter had to be raised by an imprecise amount, the distance between the phone and the fluorimeter slide was variable as they were not connected to each other and could minutely shift, and different phone models across all of the groups could very much have variance. Our product address these issues and still stays relatively cheap. We are also creating a new slide that will keep each sample separate and allow light to only penetrate the sample. This will avoid potential cross-contamination when changing out samples.
Feature 1: ConsumablesThe goal is to keep as many of the original consumable products as possible. By keeping the consumables the same, we are able to keep cost to a minimum. Our kit will contain the same liquid reagents: PCR mix, primer solution, SYBR Green solution, buffer. It will also contain the same plastic tubes. The glass slides for the fluorimeter; however, will be different. As we described above, the slides will be designed to separate each potential sample to avoid cross contamination.
Feature 2: Hardware - PCR Machine & FluorimeterWe are not redesigning the PCR machine, and are solely focusing on improving the fluorimeter design. Because the orginal fluorimeter set up is very imprecise, the system could easily be moved or knocked over when the box was moved into place or closed. Our solution is to make the fluorimeter with a built-in camera. Users will not need to worry about adjusting the height of the fluroimeter and their phone because the camera will already be at optimal distance and height from the fluorimeter slide.
| |


