BME100 f2018:Group6 T0800 L5
| Home People Lab Write-Up 1 | Lab Write-Up 2 | Lab Write-Up 3 Lab Write-Up 4 | Lab Write-Up 5 | Lab Write-Up 6 Course Logistics For Instructors Photos Wiki Editing Help | ||||||||||||||||||||||||||||||||||||||||||||||||||||||||||||||||||||||||||||||||||||||||||||||||||||||||||||||
Group 6
LAB 5 WRITE-UPPCR Reaction Report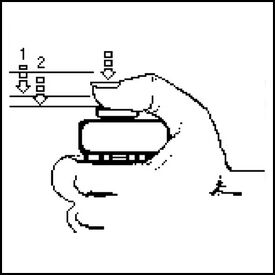 The labeling did not have to be changed because there is only one group six with each type of reaction. As the entire label fit on the tube and no other groups were similar, the labeling that had been created prior was sufficient enough. The pre-lab reading was beneficial because it labelled every step in order and explained the importance of each step. It also described typical errors that could occur which allowed us to avoid them. The first stop occurred when the micropipette first began to feel resistant to the pressure exerted by the person, yet could still be pushed down further. The second stop on the pipettor was met when the plunger is pushed all the way down. When pipetting, a few of the containers had a bit more or a bit less liquid inside even though they should have been exactly the same. Some of the error occurred from pressing the pipettor too far down in the beginning because it was difficult to gauge when the first stop occurred. The ones that had too little may have had an air bubble in the pipettor; it is possible that one or two of the solutions may have been pipetted incorrectly. Rather than push down on the stopper before it was put into the solution, one of the experimenters may have accidentally pushed it down after the tip was inserted into the solution. There was some liquid left in the previous tube which was expected; there should be more than 50 μL in each tube prior. While the prelab did warn us to look out for common mistakes, there was still a bit of trial and error. Without actually performing the lab, it is difficult to gauge the amount of pressure actually needed. Haley Strauss, Richard Yan, and James Monroe conducted the experiment. They took turns pipetting all of the components into the corresponding PCR tubes and observed what the others did. James had used micropipettes before; however, they were different than the ones at his previous school. Haley had only used a micropipette once before and picked up new techniques from both the prelab video and watching how James and Richard had done the lab. Richard had never used a micropipettor before but caught on fast after watching the other two perform the lab. Fluorimeter Procedure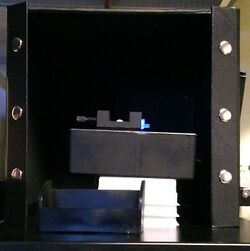 Imaging set-up
Data Collection and AnalysisImages of High, Low, and Zero Calf Thymus DNA 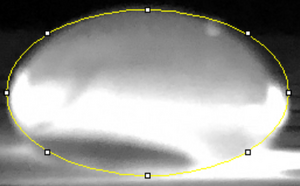 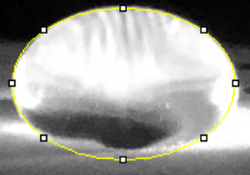 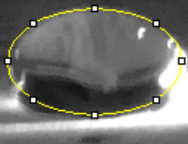 Calibrator Mean Values
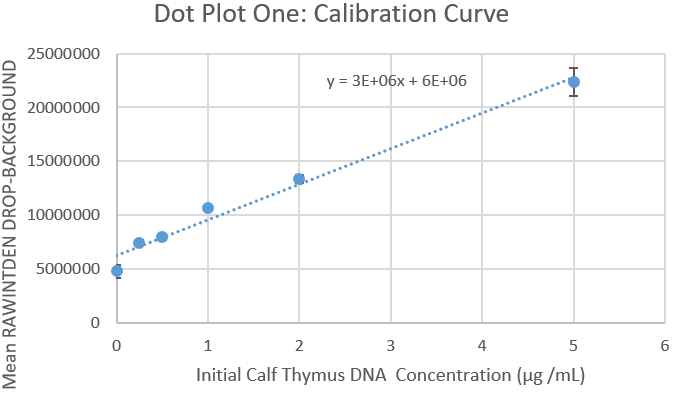
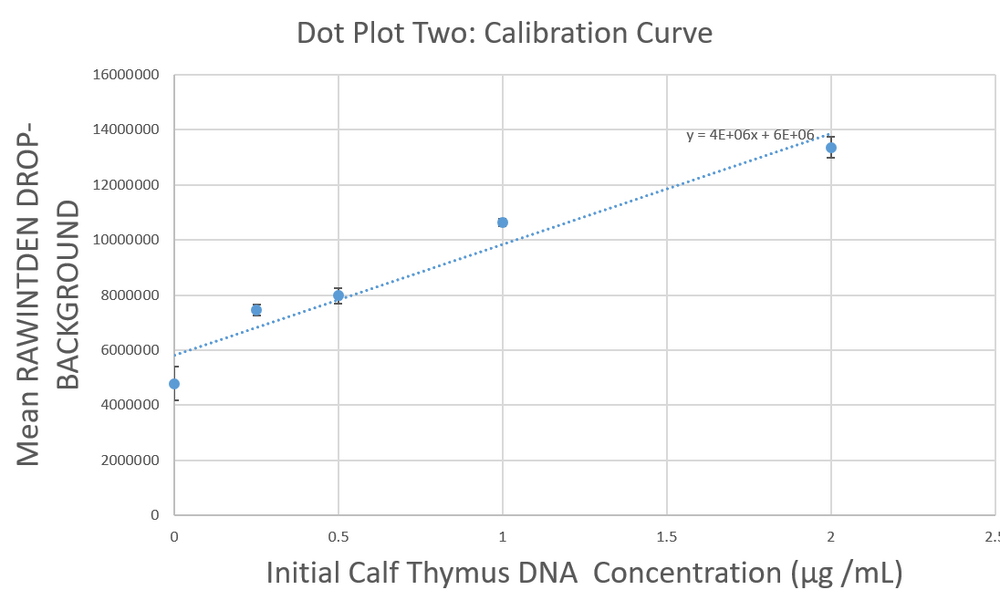
Calibration Curves Images of Our PCR Negative and Positive Controls 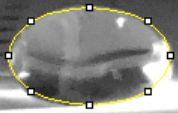 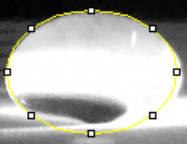
PCR Results: Summary
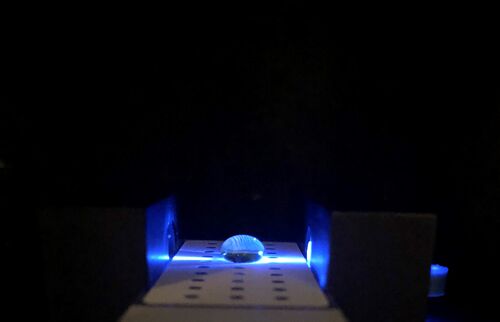
The initial concentrations of the target DNA in all three replicates of patient one are negative values. All of them are much closer to the negative control, with a concentration of -4.861992999 μg/mL, then they were to the positive control, with a concentration of 7.059383001 μg/mL. All of our patient one's concentrations were somewhat lower than the negative which is somewhat surprising. The negative results are consistent with the qualitative analysis. As the lack color suggests, patient one does not have the target DNA.
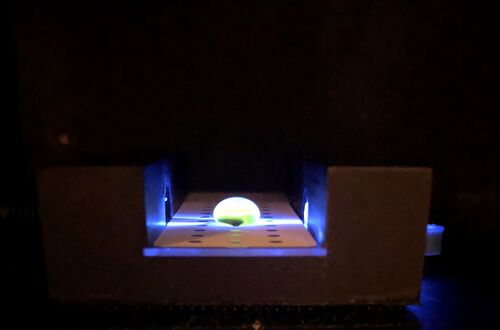
The initial concentrations of the target DNA in all three replicates of patient two are positive values. All of them are much closer to the positive control, with a concentration of 7.059383001 μg/mL, then they were to the negative control, with a concentration of -4.861992999 μg/mL. Patient two's data varied around the positive control. The third replicate was basically equivalent to the positive control while replicates one and two were either higher or lower than the positive control. However, they all were much closer to the positive than the negative control. Positive results were expected for patient two because the bright green color could be seen with the naked eye; these results confirm the predictions based on the qualitative data. Conclusions Based on the PCR product concentrations of the positive and negative controls, it was observed that the product concentration for the first patient was negative, and the product concentration for the second patient was positive. Because the positive control signifies the existence of DNA, it can be concluded that the patient with the positive PCR product concentration across all three samples would have the disease. If the DNA concentration was high enough, these DNA-positive samples would have emitted green light when observed using the Teflon glass slide. As every drop for patient two was green under the fluorimeter, we predicted that patient two (34153) would have the disease. The data confirmed our hypothesis when all of the PCR product concentrations were near the positive control values. On the other hand, the negative control signifies the lack of DNA and would have appeared clear on the glass slides. The clear droplets were observed across all samples coming from patient 1 (77683). We predicted that patient 1 did not have the disease which was confirmed by our data. However, little to no green light does not mean that there is none of the target DNA within the sample. Other programs, like ImageJ, can detect color that the human eye cannot. The calculated results, however, confirmed our suspicions that patient one's results were negative. Potential Error It is important to note that there are some potential errors within this investigation. One error could be attributed to imperfect micropippeting. Some of the group members did not have previous experience with micropippeting which would have influenced any data that would be extrapolated from that point on. These micropippeting errors may have occurred again during the fluorimeter samples which would have altered the dataset even more. Additionally, the pictures that were taken and uploaded to ImageJ for analysis may not have been the best pictures to gather data from due to the quality limits of the camera at the distance it had to take the picture from. Lastly, the ImageJ analysis of the pictures could have also been a source of error as it was hard to perfectly outline the droplets from the pictures. Future investigations should be more precise and meticulous with micropippeting technique and should also use a higher quality camera for the best quality photos and therefore, the most accurate data.
| ||||||||||||||||||||||||||||||||||||||||||||||||||||||||||||||||||||||||||||||||||||||||||||||||||||||||||||||
References
- Garcia, Michael. “How to Work a Micropippettor .” Manipulating Small Volumes, my-ecoach.com/online/resources/10488/second_stop1.jpg.


