BME100 f2018:Group4 T1030 L6
| Home People Lab Write-Up 1 | Lab Write-Up 2 | Lab Write-Up 3 Lab Write-Up 4 | Lab Write-Up 5 | Lab Write-Up 6 Course Logistics For Instructors Photos Wiki Editing Help | ||||||
OUR COMPANY
NAALOWare LAB 6 WRITE-UPBayesian StatisticsOverview of the Original Diagnosis System The BME 100 class used a Polymerase Chain Reaction (PCR) to replicate copies of the section of DNA that the SNP was associated with so that the presence of it could be detected within the entire sample of DNA. 17 groups of approximately 5 students diagnosed 32 patients total using this method. To prevent error in this process of diagnosis, each group was given a positive control DNA sample containing the DNA with the SNP and a negative control that did not contain it, so that the results of the patient samples could accurately be compared to that of samples with definitive results. Groups were given 3 samples per patient to prevent errors in diagnosis in the case of false positives or negatives. The ImageJ software was calibrated using 6 known concentrations of calf thymus DNA so a proper DNA concentration could be concluded from the PCR images. Also, during the diagnosis process, three images were taken per sample. These preventative measures aimed to reduce error and increase the reliability of the PCR diagnosis process. The results concluded that 14 patients tested positive for the disease-causing SNP, and 17 patients tested negative. 1 patient’s DNA had inconclusive results given the data. One group had no data for their patients. Difficulties with the PCR process arose from the high variability of the results of the RAWINTDEN per image and sample group, resulting in difficulty in comparing the data with that of the positive and negative controls. Issues with micropipetting the various solutions throughout the process may have lead to errors in measurements and inconsistencies in enzyme/DNA concentration. What Bayes Statistics Imply about This Diagnostic Approach Calculation 1 resulted in a Bayes Statistic value close to 1 (100%), which means that the PCR process used by the class is highly sensitive to the presence of the SNP. Calculation 2 resulted in a probability value very close to 1, showing that the process is accurate and reliable in detecting the SNP due to the high probability values for both showing a negative result when negative and a positive result when positive. Calculation 3 resulted in a probability value in between 0 and .5, showing that there is low likelihood that the detection of an SNP in a given patient’s PCR results will result in the development of the disease. Calculation 4 gave a probability value close to 1, demonstrating that the likelihood of developing the disease without the SNP is very low, showing the specificity of the diagnosis process. Errors could have come from the micropipetting process that would have led to incorrect values for DNA samples and/or enzymes and incorrect data values. Another source of error could include incorrect placement of the fluorimeter light on the drop so that distance from the camera and RAWINTDEN values were not consistent, resulting in skewed data. Another source of error could have resulted from an inaccurate calf thymus calibration curve, which would result in skewed concentration data for the patient samples. Intro to Computer-Aided Design3D Modeling Our Design
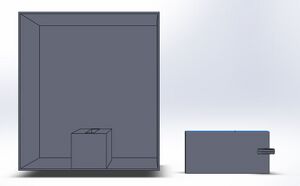
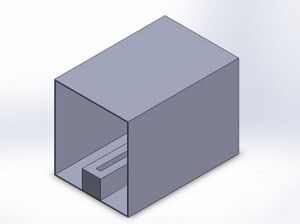
Feature 1: ConsumablesAlthough the consumables did not to be redesigned for our redesigned product, we decided to include a pack of glass slides for our product, as they are important for PCR testing and our product design, in particular, makes the replacement of glass slides on the fluorimeter much easier. The other consumables are not necessary for the kit and would require too much packaging and manufacturing costs to be financially beneficial. Feature 2: Hardware - PCR Machine & FluorimeterThe new design of the fluorimeter box helps make the changing of glass slide samples much easier. When the PCR samples are ready to be recorded on the fluorimeter, the glass slide will be placed on the fluorimeter. The fluorimeter can be slid out on the track while the lightbox is still on it. Drops of patient sample can be added to the already placed glass slide, and slid back to the desired position so that images can be taken on the phone. The lightbox is closed and recording can begin. The fluorimeter box helps address the time-consuming issue of changing the glass slides and focusing the images on the phone. By including a moving track for the fluorimeter, the lightbox does not have to be removed (which can be inconvenient and may hit the slides causing damage to the samples) for the changing of PCR samples. The track also allows the image to be focused on the phone more easily by keeping the fluorimeter in place side-to-side while being able to move it forward/backward.
| ||||||


