BME100 f2018:Group17 T1030 L6
| Home People Lab Write-Up 1 | Lab Write-Up 2 | Lab Write-Up 3 Lab Write-Up 4 | Lab Write-Up 5 | Lab Write-Up 6 Course Logistics For Instructors Photos Wiki Editing Help | ||||||||||||||||||||||||||||||||||||||||||||||||||||||||||||||||||||||||||||||||||||||||||||||||||||||||||||||
TEAM 17
LAB 6 WRITE-UPBayesian StatisticsOverview of the Original Diagnosis System BME100 tested patients for a Parkinson's disease-associated SNP. 17 teams of 4 to 5 students diagnosed 34 patients. The work was divided by assigning 2 of the 34 patients to each of the 17 groups. In order to provide consistency and limit errors throughout the groups, three replications of each patient's sample were ran through the PCR machine along with positive and negative control groups, similar imaging stations were set up for analysis, and the analysis software used was the same for each group. Calibration tools for the imaging stations all used calf thymus DNA concentrations. Each of the patients' samples were divided into three smaller samples, which were used to create a solution for the PCR machine. This enabled us to ensure that our results were consistent with the other, and provided us with a "back-up" in case something went wrong with one of the solutions. The negative and positive controls allowed us to observe any discrepancies in the process, as anything but a negative (no-DNA) and positive (yes-DNA) respective result would have alerted us if something was incorrect. The imaging station was the same throughout each group, and the standards were the same. The imaging software, ImageJ, was used by each group to determine the positive or negative results for each of their PCR samples. Each sample used three droplets for consistency purposes, and the means of these droplets were used for diagnostic purposes. Discrepancies may arise due to the variability in phone cameras or distances of the phones from the droplets. Droplet size may also vary between groups. The PCR samples may have also been contaminated with other DNA, and, in some cases, the amount of samples used to create the PCR samples were not enough. The results for each patient are described below.
What Bayes Statistics Imply about This Diagnostic Approach
Calculation 2 is the chance that a patient's test result will be negative, and that it is an accurate conclusion (the patient actually does NOT have the SNP, and the PCR test results say so).i.e., there is a "this chance" that the individual was properly diagnosed with a true negative.
Calculations 3 and 4 are the chance that a patient's test result will indicate the development of the disease. They describe the probability of the patient developing the disease indicated by a positive test result and the probability of the patient NOT developing the disease indicated by a negative test result, respectively.
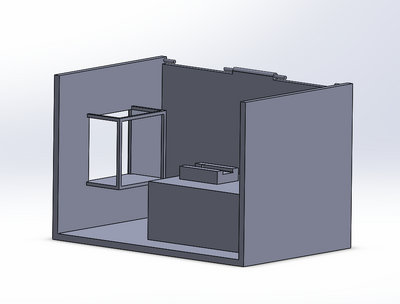
Intro to Computer-Aided Design3D Modeling Group 17 used SolidWorks in order to design our new fluorimeter machine using computer-aided design. SolidWorks allows us to view a 3-dimensional rendering of our product, and to manipulate different dimensions to achieve the accuracy in imaging we needed to create a more stable product. Each individual piece was designed around capturing the image of the drop consistently and accurately. We no longer wanted the camera or fluorimeter to move, yet still wanted to show how the ceiling could open up for easy access to sample placement. SolidWorks allowed us to create using the exact dimensions for the finished product, and provided us with a drawing that can be used during production. Our Design
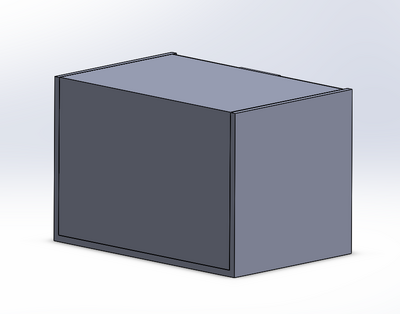
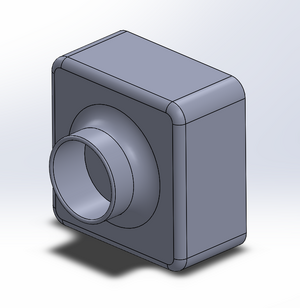
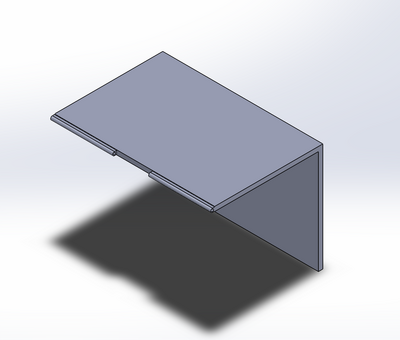
This design provides the user with ease of access to the glass slide on the fluorimeter light, as shown in image 2. Image 4 shows how the door would attach and move between light blocking and access-open positions. Images 2 and 3 detail how the camera would fit into its block, stabilizing it and providing consistent images. The entire unit is built together in order to prevent the camera focusing and position changes we experienced during our procedure (image 1).
Feature 1: ConsumablesOur product is a redesign of the fluorimeter machine we used in order to make it more friendly to class lab applications. It provides uniformity in measuring the DNA values of each droplet, thus providing consistency throughout a group experiment. Due to this, our machine requires all of the consumables used in lab 4 that were used to run the PCR machine and place droplets on the glass slide (PCR reaction mixes, tubes, pipettes, ect) to be provided by the user. ImageJ is still used so that each student can manipulate their data. A "how-to" guide covers the importance of proper pipetting techniques and how to use the fluorimeter with ImageJ. Our machine does require connection cords, which are built in to the box and provided. Feature 2: Hardware - PCR Machine & FluorimeterThe OpenPCR machine is still used "as-is" in our design. We exchanged the fluorimeter for our "Fluore-Sense" fluorimeter. Our fluorimeter provides more consistency in imaging, leading to more overall consistency in sample comparison and diagnosis. It also has easy set-up procedures, simply needing to be attached to a power supply and a laptop for image transference. Our imaging system does require some technical "know-how," as the images are meant to be immediately transferred to a laptop. A file for the image transfer, as well as monitoring to maintain sample ID matching with the images is required.
| ||||||||||||||||||||||||||||||||||||||||||||||||||||||||||||||||||||||||||||||||||||||||||||||||||||||||||||||
