BME100 f2018:Group16 T1030 L6
| Home People Lab Write-Up 1 | Lab Write-Up 2 | Lab Write-Up 3 Lab Write-Up 4 | Lab Write-Up 5 | Lab Write-Up 6 Course Logistics For Instructors Photos Wiki Editing Help | |||
OUR TEAM OF NINJASOur Brand Name LAB 6 WRITE-UP GROUP 16Bayesian StatisticsOverview of the Original Diagnosis System The BME 100 class conducted the PCR lab, where there were 17 teams each team containing 4-5 students. 34 patients' DNA samples were tested and three tests were run per patient. After conducting the tests all the results were analyzed and each group came up with their positive or negative diagnosis for each patient. In order to prevent error, three tests were run per patient. Running multiple tests per patient helped prevent errors because it provides multiple data results for comparison. Additionally, it helps get a more accurate result after averaging the three results. Also, if there happened to be an error in one trial, the two other trails were available to base results off of. Another precaution to try and prevent further error was that there were positive and negative controls. The positive and negative controls gave guideline data to compare our results with. This was helpful in detecting any errors in the experiment. When capturing images, for each calibration as well as each patient replicate, each group took three pictures. Our images were processed in ImageJ. We calibrated ImageJ using Calf Thymus DNA solution and SYBR green. The results from these three pictures were then averaged and used for our final calculations. In the end, all of the final calculations from every group were compiled into a single excel spreadsheet. Overall, the results were fairly mixed. There were also a few inconclusive results. In addition to those results, there were some noncongruent results where the conclusion would show up positive but there was no disease found within the patient's DNA.
What Bayes Statistics Imply about This Diagnostic Approach Calculation 1 provides the probability that a patient will receive a positive final test conclusion given a positive PCR reaction. This value was about 94%. Calculation 2 gives the probability that a patient will receive a negative final test conclusion given a negative PCR reaction. This value was about 98%. Because calculations 1 and 2 are quite close to 100%, this means the PCR is reliable in giving a correct diagnosis, though it is slightly more reliable in giving a correct negative diagnosis than a correct positive one. Calculation 3 provides the probability that a patient will develop the disease given a positive final test conclusion. This value was only about 33%, meaning the diagnosis is not very reliable in predicting the actual development of the disease and is prone to giving a false positive. Calculation 4 gives the probability that a patient will not develop the disease given a negative test conclusion. This value is quite high at 96%, meaning the diagnosis is reliable in not providing a false negative.
1. Human: Placing the sample drop correctly on the slides with the excitation/blue LED light directly through it. ~ImageJ isn't able to properly analyze the picture if the light isn't going directly through the sample drop. 2. Machine: Taking pictures that have minimal light interference. ~The set up of the light blocking box made some phones take pictures low light settings, which could interfere with the proper color of the DNA samples. In turn messing with the ImageJ processing. 3. Machine/Human: Maintaining the camera and the fluorimeter at the correct height consistently. ~The fluorimeter had to be raised up stacking small boxes/containers and the camera set up would get slightly moved around when taking the pictures and when the light box was lifted to place new samples in.
Intro to Computer-Aided Design3D Modeling Our Design
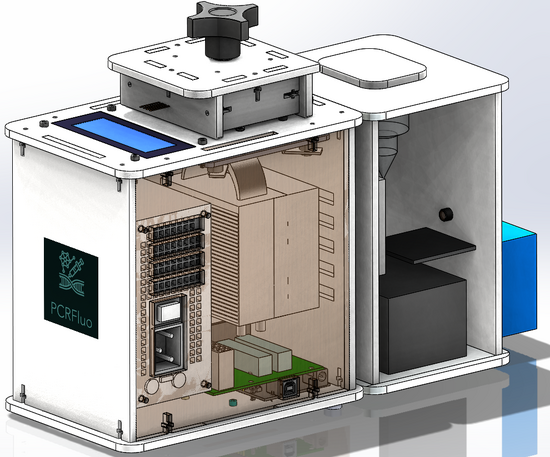
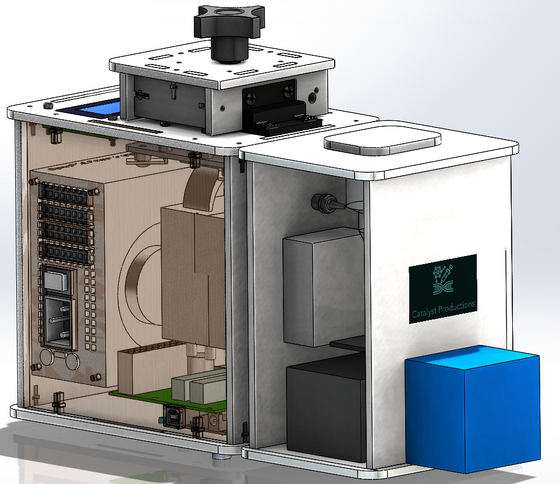
Our design consists of a PCR machine, a fluorimeter, and light box all combined into one efficient device. Our group chose this design as we expressed frustration using the ImageJ software as getting the region of interest to be consistent was difficult as well as the amount of work that is dependent on the users who are conducting the experiment and their ability to not mess anything up. The way that our group was thinking was to minimize the percent error and maximize the efficiency in order to not have to have trials on the same sample multiple times. The way our new system differs from the original OpenPCR design is that it has a completely different process once the PCR tubes exit the machine. Our approach has the user manually transfer PCR tubes into the box on top of the fluorimeter which connects to the users phone via app. The app allows the user to dictate what is measured and when the user wants to start the process. After that, the procedure begins which has the PCR tubes taken down separately one by one by the transfer tube to the assembly line, where a glass slide will be sitting. Next, a drop from a tube will be transferred to the glass along with SYBR green via micropipette that is on the inside of the machine. Subsequently, the LED light attached to the fixed camera shines through the drop and the camera takes however many photos the user wants and the desired contrast, brightness, and saturation settings based on what they imputed on the app. After the photos are taken, they are sent directly to the user's phone already digitally analyzed to avoid human error and the assembly transfers the glass slide into the biohazard container that is on the end of the machine and runs the process again with the next PCR tube.
Feature 1: ConsumablesConsumables kit: pre-package tubes, tips, micropipettor within the PCR machine itself for fluorimetry. Over consumables: glass slides, buffer, SYBR Green solution, PCR mixture.
In a standard PCR machine, the usual consumables that are required are a mixture of various organic materials, or a PCR mix. They allow for the process of DNA/genetic code replication on a single desired section to take place. Some of the following ingredients include: a source of the DNA that is to be replicated, two separate primers that will attach to the strands of DNA in the process, nucleotides that will make up the genetic code, among other ingredients. All combined, they are added to the PCR machine to be heated and cooled so that the bonds between the genetic material can be broken and reformed to create billions of strands of code for other projects/intentions. Our PCR machine focuses on efficiency and effectiveness of design to quickly set up a PCR procedure. It was with this knowledge that we decided to add an automatic system that would add the PCR consumables along with SYBR Green for it to be used in a fluorometer. Ease of access is the main advantage; without the added hassle to refill the necessary products for a PCR and for the fluorometer. SYBR Green I that will be pipetted onto the slide and biohazard containers will be implemented to house the DNA waste and the slides that can be taken out. The whole goal is ease of access, as aforementioned. The PCR requirements will be added and have an option to refill automatically. The buffer will automatically be added aswell, making sure the slides are prepped for the procedure, as well as everything else. Overall, the main disadvantage that this has is a risk of failing within the machine. It is possible that a critical error occurs and the machine stops the process entirely, leading to undesired maintenance or, in a worst case scenario, a leak in the system which would damage the entire product. Through careful construction and a well-thought out design, which is provided, it is unlikely that these cases will occur. The bio-hazard waste container could also overflow/spill, and that entails the same risk. Feature 2: Hardware - PCR Machine & FluorimeterIn order to properly explain how our fluorometer will be implemented in our original device, we must first understand what a fluorometer is. A fluorometer is a device that measures and detects florescence. In the case of a PCR procedure, once the heating-cooling process is completed and the solution is filled with billions of strands of desired DNA, the fluorometer will illuminate the droplet, proving that the process was successful. On the other hand, a PCR machine is a device that takes a desired fragment of DNA/genetic code that must be replicated and does so over billions of times. Overall, the rest of the machine will not be resigned drastically. There will be an increased volume in the test-tube area in order to allow for a greater number of procedures in a shorter amount of time. This allows our product to automatically be more desirable than the majority of PCR machines in the market. An all-in-one system will be the goal for our product. Both the Open PCR machine and fluorometer will be implemented together as a single component. The PCR machine will automatically create copies of the desired genetic code and flow directly to the washed fluorometer tray. The fluorimeter will have a reservoir of As mentioned earlier, SYBR green and the buffer solution will be used and prepared to prep the final product for documentation, which in our case is photographic. There will be a fixed camera and a LED light that will take a specified amount of pictures once it is detected that the DNA sample is centered on the slide and stable, and an app where you can specify the amount of pictures wanted at specific contrast, saturation, and those photos will be sent to the app already analyzed to avoid human error. All of the aforementioned implementations are advantages that are held over the common Open PCR device, with the main one being the fact that the compactness and overall ease to use. The main disadvantage that this holds is the fact that internal camera may not produce be as clear as desired. Once it is implemented into the system, most likely new models will have to be improved on, leading to an increase in cost. Other disadvantages include various hardware issues, however, that can be tinkered with throughout development.
| |||


