BME100 f2018:Group15 T0800 L6
| Home People Lab Write-Up 1 | Lab Write-Up 2 | Lab Write-Up 3 Lab Write-Up 4 | Lab Write-Up 5 | Lab Write-Up 6 Course Logistics For Instructors Photos Wiki Editing Help | |||||||
OUR COMPANY
Holster Bolster LAB 6 WRITE-UPBayesian StatisticsOverview of the Original Diagnosis System In order to get the most accurate results possible, the class split up into groups so that we can get as many results as possible. There were seventeen teams that were made up of about six students each. All the teams tested for thirty-four different patients to determine the accuracy of the PCR testing. Each group did multiple tests to get as little error in their results as possible when they average them. Each group individually measured the controlled substances like water. Each group was responsible for taking three pictures and scanning them each on ImageJ. The final data for the class did not come out as accurate as we hoped. Some possible errors were that may have occurred were accidentally mixing up the test tubes or the images taken in Lab D. Some of the images taken were blurry and hard to determine on ImageJ. What Bayes Statistics Imply about This Diagnostic Approach
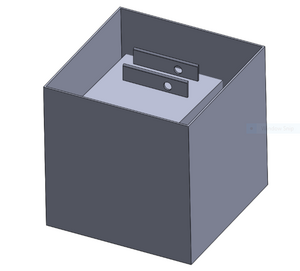
One source of error could have been from incorrectly taking a clear photo from the fluorimeter. The precision of each of the photos could have been off. Another source of error could have been mixing up the label tubes and cross contaminating. A third source of error could have been from not human error in cutting out images using ImageJ for calculations. Intro to Computer-Aided Design3D Modeling Our team decided to use Solid Works to create our new design. We chose this program because most of the group members are currently taking BME 182 and have had previous experience with the program. Solid Works worked really well for our group because it was able to do everything that we needed in order to present our design in three dimensions. We did not have too many issues using it. It took some time to feel comfortable with all the tools that were needed to efficiently build our device. Our Design We focused our design on improving the fluorimeter. In conducting our experiment, we found that the step that produced the greatest amount of error was with the fluorimeter. Our designed combines multiple parts of the fluorimeter we used to lower the number of variables and to make the process a little simpler. The black box with the blue light has a strap to secure the phone at all times. Also, attached to the device is a big, black box to stop light from entering. We figured that the box we were using to minimize light in the experiment was bigger than it had to be to effectively fulfill its role so we shrank it.
Feature 1: ConsumablesWe did not find too many issues with the consumables that we were using. They did not seem to cause any sources of error in our experiment. It did not slow us down in efficiently completing the lab. So for our new design, the consumables used will be the same as were used in our lab. There will be no change in the consumables at all because it is unnecessary. Our model does not create a need to change the design of the consumables. Feature 2: Hardware - PCR Machine & FluorimeterIn our experiment, our group concluded that there were no major issues with the PCR machine. In our new design, the existing fluorimeter will be used and it will work fine with the rest of the experiment as it is already. However, the fluorimeter's design will be changed to our own. It will still be used in the PCR experiment. We are redesigning the Fluorimeter to address issues with the many individual parts that come with it. In conducting the experiment, we are removing the tray to hold the phone and adding a strap directly to the fluorimeter box. An additional change is to reduce the size of the big, black box that blocks light. This allows for the fluorimeter to be much easily transportable and for the person conducting the experiment to have more desk space.
| |||||||


