BME100 f2018:Group14 T1030 L6

From OpenWetWare
Jump to navigationJump to search
BME 100 Fall 2018 Home
People
Lab Write-Up 1 | Lab Write-Up 2 | Lab Write-Up 3
Lab Write-Up 4 | Lab Write-Up 5 | Lab Write-Up 6
Course Logistics For Instructors
Photos
Wiki Editing Help

OUR COMPANY

Name: Carlos Matherson
Role: Resident Lab Dude
Name: Michael Esposito
Role: SNP Researcher
Name: Mohamed Sorkati
Role(s)
Name: Branden Dora
Role(s)
[1]
Name: Daniel Bhella
Role(s)

Our Brand Name

LAB 6 WRITE-UP

Bayesian Statistics

Overview of the Original Diagnosis System ,
The PCR investigation tested for the SNP correlated with Parkinson's disease in humans by distributing equal work between 17 teams of 5 students. Each team was assigned 2 patients and controls resulting in the diagnoses of 34 patients total. In order to ensure error was minimized, there were 3 replicates per patient and the settings for the PCR thermocycling were standard across all groups. Calculating the concentration of the SNP in each patient sample was done through ImageJ. Calf Thymus DNA was used to calibrate the results from ImageJ. In order to get the most accurate results, 3 images were used per drop per unique PCR sample. The overall collective data from the class showed that there is a 96 percent probability of the patient not developing the disease if tested negative for the SNP. We encountered challenges when collecting the data via photography because the apparatus used to make the setting dark enough to capture the fluorescence of the drop was inconsistent and unreliable somewhat, which could have affected our data. Additionally, every drop we photographed lacked fluorescence.


What Bayes Statistics Imply about This Diagnostic Approach

Calculation 1 and calculation 2 were both close to 100%. For calculation 1, this implies that the test is very reliable in detecting and displaying the SNP, and is very likely to detect the SNP again if the test is ran multiple times. For calculation 2, this implies that the test is very reliable in concluding that the SNP was not present, and the test is very likely to return these same results if the test is ran multiple times.

Calculation 3 was close to 50% and calculation 4 was close to 100%. For calculation 3, this means that about half of the time, the test was effective in predicting that a patient was diagnosed with Parkinson's disease, and would be somewhat reliable to return these same results if ran multiple times. For calculation 4, this means that the test was very effective in not returning false positives, predicting that a patient had not been diagnosed with Parkinson's disease, and would be very reliable to return these same results if ran multiple times.

  • Calculation 1 describes the sensitivity of the system regarding the ability to detect the disease SNP.
  • Calculation 3 describes the sensitivity of the system regarding the ability to predict the disease.
  • Calculation 2 describes the specificity of the system regarding the ability to detect the disease SNP.
  • Calculation 4 describes the specificity of the system regarding the ability to predict the disease.


Three possible sources of error:

  • Error could have resulted from switching the lab member responsible for pipetting.
  • The pictures could have been botched if the darkness was interrupted before the picture was taken.
  • Any inconsistencies in the ellipse drawing in imageJ could have caused error in the results.

Intro to Computer-Aided Design

3D Modeling
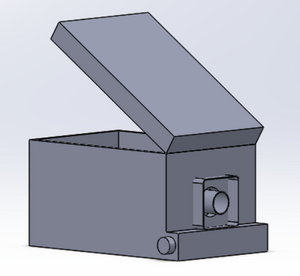
In order to model our device, we chose to use SolidWorks. We combined multiple parts into an assembly, which required us to think about certain important measurements. Edges of different parts being joined together had to be compatible with each other, both in angle and in length. For example, we had to make sure that the circular hole in the side of the box had a radius compatible with the radius of the camera. Also, we had to ensure that our parts were all scaled correctly. For example, we certainly would not have wanted to make the body of the camera larger than the side of the box. The most important strategy we used in CAD was writing out measurements on paper for the parts before we actually started modeling them on the computer, so that they would all be compatible when put together in the assembly.

Our Design


Our design is a modification to the fluorimeter, phone stand, and light-obstructing box setup that is designed to make the fluorimetry process more accurate and user-friendly. We combined the camera, the box, and the fluorimeter into one piece in order to eliminate the hassle of changing the height of the fluorimeter and angling the phone correctly. The camera is integrated into the side of the box, and there is a track along the bottom of the box that the fluorimeter is attached to. On the side of the box, there is a knob used to adjust the fluorimeter's horizontal position on the track, which would be used in conjunction with the focusing feature of the camera. The height of the fluorimeter does not need to be adjusted because the camera is fixed, already positioned at the correct height in relation to the slide and drop of solution.

Feature 1: Consumables

We were able to identify a major strength as well as a major weakness with the consumables used in this experiment. One strength of the consumables is that they are quite low in cost for the most part, relative to the other components of the experiment. Also, the consumables are very simple and easy to use. This combination is one that would be very difficult to keep if we make a major change. A major weakness of the consumables is that they are very susceptible to human error, which in turn can lead to inaccuracy or even contamination. Therefore, because of the benefits aforementioned, we will not be altering any consumables in our new design.

Feature 2: Hardware - PCR Machine & Fluorimeter

One major flaw when it comes to the PCR machine is that it took a long period of time to finish. It was long enough that we could not complete the experiment in the time allotted. Overall, it took about two hours to complete. Although this is a rather annoying and time-consuming issue, it cannot be understated how important it is that it performs its job reliably. If the PCR machine does not do this correctly, it will ruin the entire experiment. For that reason, we will not be altering this aspect of the experiment in any way for fear of messing up the entire experiment.

The fluorimetry process is the part of the experiment that we deemed to be the most flawed. It is quite inefficient in a number of different aspects. Most notably, the reset time between trials is far too long because the stand for the phone is unstable most of the time, thus, requiring multiple minutes just to obtain one measurement. Also, only being able to run one trial at a time creates unnecessarily wasted time between trials. However, a great strength of the fluorimeter is that it is relatively low in cost.

In order to preserve the low cost of the fluorimetry process and alter the inefficiencies of it, we decided to redesign it. The redesign consists of a track for the fluorimeter to be connected to, and the fluorimeter will be able to move along the track via the use of a knob. This will allow for there to be a lower number of resets. Also, the camera will be fixed into a hole on the box. For a more detailed explanation, refer to the section shown above.