BME100 f2018:Group14 T1030 L5
| Home People Lab Write-Up 1 | Lab Write-Up 2 | Lab Write-Up 3 Lab Write-Up 4 | Lab Write-Up 5 | Lab Write-Up 6 Course Logistics For Instructors Photos Wiki Editing Help | ||||||||||||||||||||||||||||||||||||||||||||||||||||||||||||||||||||||||||||||||||||||||||||||||||||||||||||||||||||
OUR TEAM
LAB 5 WRITE-UPPCR Reaction ReportThe pre-lab reading definitely improved our micro-pipetting technique, and aided in our overall understanding of what we were accomplishing by moving substances to and from test tubes. Being able to understand the difference between the first and second stop on the pipettor helped us prepare more accurate solutions, which would make for more ideal and accurate results. The experienced technique we developed by thoroughly reading the pre-lab material allowed us to pipette the liquids so that the test tubes all had nearly, if not exactly, the same amount of liquid in them. Being precise in the amount of specific liquids in the test tubes was important because of the interactions that needed to take place between the fluids. For example, if the ratio of SYBR Green dye to Calf Thymus DNA is skewed, then the results obtained in ImageJ would not be accurate. Another area in which precision was important was the labeling of the test tubes. If one patient's DNA sample was mislabeled and confused with the positive control, then this patient would have been misdiagnosed as having the diseased SNP and the results would have been invalid. Fluorimeter ProcedureImaging set-up To set up the imaging for the DNA samples, we obtained a light-obstructing box, a fluorimeter, two closed and empty test tube racks (to stand the fluorimeter on), a sufficient amount of slides, a smartphone camera, and a stand to place the smartphone in. The smartphone camera was set to have a five second timer, the highest ISO setting at 800, the highest exposure setting at 1/4 s, the highest saturation setting, the lowest contrast setting, and the flash turned off. Had the camera we used not had changeable settings, the default settings would have sufficed, as long as the flash was disabled, and a 3-10 second timer was enabled. Additionally, three pictures of each sample must be taken. Another important part in setting up the imaging was obtaining the correct camera angle. For the most effective measuring of the fluorescence, the camera must be angled so that the image captured is a perfect side view of the drop of liquid. In other words, the lens of the camera should be perpendicular to the textured face of the slide.
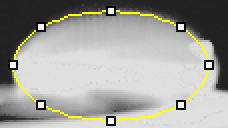
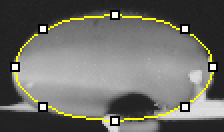
Data Collection and AnalysisImages of High, Low, and Zero Calf Thymus DNA High Concentration Calf Thymus DNA
Calibrator Mean Values
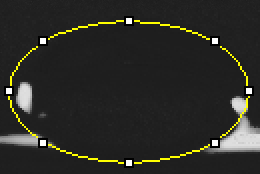
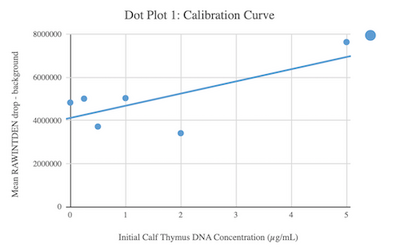
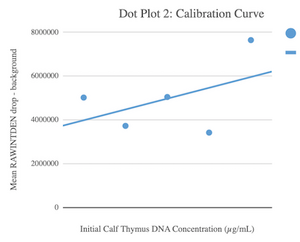
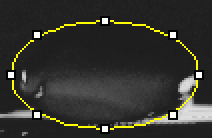
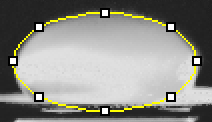
Calibration curves Images of Our PCR Negative and Positive Controls Negative Control Positive Control PCR Results: PCR concentrations solved
PCR Results: Summary
Conclusions
| ||||||||||||||||||||||||||||||||||||||||||||||||||||||||||||||||||||||||||||||||||||||||||||||||||||||||||||||||||||


