BME100 f2018:Group13 T0800 L6
| Home People Lab Write-Up 1 | Lab Write-Up 2 | Lab Write-Up 3 Lab Write-Up 4 | Lab Write-Up 5 | Lab Write-Up 6 Course Logistics For Instructors Photos Wiki Editing Help | |
MedSonic
LAB 6 WRITE-UPBayesian StatisticsOverview of the Original Diagnosis System In the lab, 17 groups of students were assigned 2 patients each, for a total of 34 patients to be tested for the disease-associated SNP. To prevent error, each group produced 3 replicates per patient, giving each group a total of 6 replicates, in addition to positive and negative controls. To further prevent error, for each replicate 3 separate images were produced, which in total resulted in 24 unique images. By using ImageJ in combination with these images, each group was able to produce a set of values measuring the amount of SYBR Green present in each photograph. These values were then compiled into several calibration curves, to provide a better visual understanding of the data set. The values from the data set were averaged to provide several numbers to represent the positive control, the negative control, patient one, and patient two. We compared the average of patient one to the averaged values of the positive and negative controls, and determined that patient one was most likely positive. We then compared the average of patient two to the averaged values of the positive and negative controls, and determined patient two was also most likely negative. The 17 groups all pooled their data of reported positive and negative results of their patients, and these results were all put into a spreadsheet, comparing them with the known results of the patients. Ultimately, the 17 groups had an accuracy of around 50%, and the results were probably largely affected by contamination of the samples.
Calculations 1 and 2 compute the probability that the PCR results will actually return the correct diagnosis. Specifically, calculation 1 is the probability that the sample has the cancer DNA sequence, when the PCR results give a positive diagnostic signal; for this lab, it is approximately a 95% probability. Calculation 1 is the probability that the sample contains a non-cancer DNA sequence, when the PCR results give a negative diagnostic signal; for this lab, it is approximately 95%. Calculations 3 and 4, however, compute the probability that the results will accurately be able to predict the development of cancer in a patient depending on their PCR results. Calculation 3 finds the probability that the patient will develop cancer, when the PCR test finds that they have a cancer DNA sequence; this computes to be about 35%. Calculation 4 finds the probability that the patient will not develop cancer, when the PCR test finds that the patient has a non-cancer DNA sequence; for this lab it is about about 85%. Some possible sources of error that may have effected the Bayes values negatively could include poor image qualities, improper droplet placement, and improper phone positioning. Poor image qualities would have affected the values measured by the ImageJ, thus affecting the concentration of DNA detected in the patient samples. This would have negatively impacted the results and lead to the incorrect diagnosis of the patients. A combination of improper placement of the droplet on the slide and the improper phone positioning, however, would have caused images that could not be used for ImageJ. If the phone and droplet are misaligned in the flourimeter box, the pictures that are taken would not perfectly capture the green light reflected by the SYBR Green. This would negatively influence the values measured by ImageJ. Intro to Computer-Aided Design3D Modeling
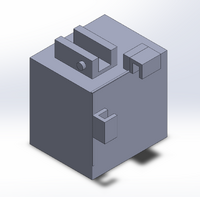
Feature 1: ConsumablesWhen it comes to consumables, there are many different types and they all come in different forms. It can be a solid, a liquid, or any materials. In most kits, the most essential consumables are included because if it were to have every item that you need then the size for the box would be too large. These very important consumables are the items that are essential in making sure that the experiment or the data is gathered through the materials you are given. There should be no need for you to acquire other items. Our team is not changing anything too major to result in changing the consumables. We will actually be combining two parts of the kit together to increase efficiency. The consumables that will be combined are the fluorimeter and the phone holder so that will be one less item in the kit. Along with the kit, the box will be provided with the most important consumables: Feature 2: Hardware - PCR Machine & FluorimeterThe Open PCR machine will be used as it was before, and no modifications will be made to it since this device is reliable but cheaper than other, more advanced PCR machines. It fulfills its function of changing the temperature of DNA samples to enable replication of the strands and does not have any major weaknesses that have a significant impact on the results of the testing. The fluorimeter is what is being modified to improve the system. This will allow the data analysis to be more accurate and easier to complete due to higher quality imaging of the droplets in the light box.
| |


