BME100 f2017:Group1 W0800 L6
OUR TEAM: HAYAT HEALTH
 Micropipette Expert |
 Group Sass |
 Team Member |
 Team Mascot |
 Team Captain |
 Morale |
LAB 6 WRITE-UP
Bayesian Statistics
What is the probability that a patient will get a positive final test conclusion, given a positive PCR reaction?
P(A|B) = P(B|A) *P(A) / P(B)
| Variable | Description | Numerical Value |
|---|---|---|
| A | Positive final test conclusion | 0.25 |
| B | Positive PCR | 0.274 |
| P(B/A) | Positive PCR, given a positive test conclusion | 0.954 |
| P(A/B) | Positive test conclusion, given a positive PCR | 0.870 |
What is the probability that a patient will get a negative final test conclusion, given a
negative diagnostic signal?
| Variable | Description | Numerical Value |
|---|---|---|
| A | Negative final test conclusion frequency | 0.714 |
| B | Negative PCR frequency | 0.679 |
| P(B/A) | Negative PCR, given a negative test conclusion frequency | 0.8 |
| P(A/B) | Negative test conclusion, given a negative PCR frequency | 0.841 |
What is the probability that a patient will develop the disease, given a positive final test
conclusion?
| Variable | Description | Numerical Value |
|---|---|---|
| A | Patient will develop the disease | 0.25 |
| B | Positive final test conclusion | 0.25 |
| P(B/A) | Positive final test conclusion, given the patient will develop the disease | 0.571 |
| P(A/B) | The patient will develop the disease, given positive final test conclusion | 0.571 |
What is the probability that that a patient will not develop the disease, given a negative final test conclusion?
| Variable | Description | Numerical Value |
|---|---|---|
| A | Patient will not develop the disease | 0.733 |
| B | Negative final test conclusion | 0.679 |
| P(B/A) | Negative final test conclusion, given the patient will not develop the disease | 0.842 |
| P(A/B) | The patient will not develop the disease, given negative final test conclusion | 0.909 |
What calculation describes the sensitivity of the system regarding the ability to detect the disease SNP? Calculation 1, 0.870
What calculation describes the sensitivity of the system regarding the ability to predict the disease? Calculation 3, 0.571
Which calculation describes the specificity of the system regarding he ability to detect the disease SNP? Calculation 2, 0.841
Which calculation describes the specificity of the system regarding the ability to predict the disease? Calculation 4, 0.909
Computer-Aided Design
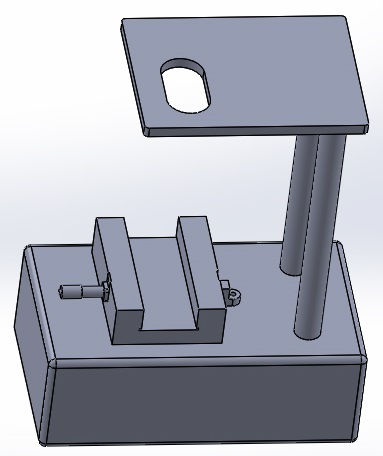
It was determined that one weakness of the system could be found in the fluorimeter set up. In order to save on cost, the PCR machine will remain the same and a small improvement to the fluorimeter device will be added. In order to maximize the amount of the drop captured in each picture, and to ensure consistency between pictures, a camera cradle will be added above the fluorimeter that can be adjusted and locked to a specific height. This will ensure consistent distance between the drop and the camera for each picture, and will capture a greater area of the drop, due to the fact that the photo will be taken from above, instead of from the side.
Feature 1: Reagents & Supplies
Since PCR machine still the same, our reagents & supplies change. The only difference reside only on the absence of the cradle in which we put our phone camera to take pictures of the drop. The new set up will be a holder placed at the top of our slide where we put DNA sample. The new holder will be set up in way the distance between the slide and the camera is constant. The DNA drops will be placed on the slide using a micropipette held at a slight angle to ensure the camera cradle isn't bumped out of alignment.
Supplies Needed
DNA Samples from PCR Machine
Labels for tubes
Empty Tube Rack
SYBR Green Solution
Micropipette
Disposable Pipette Tips
Waste Container for used tips and slides
Sample Calibration DNA
Water for Calibration set-up
Glass Sample Plates
Feature 2: Hardware - PCR Machine & Fluorimeter
PCR Machine: After careful consideration we decided to leave the PCR machine as it is and instead focus on the design of the fluorimeter.
Fluorimeter: In the previous design of this component, one of the weaknesses was that the camera's position was not fixed. Thus, the picture taken was not always reliably of the same angle of the drop, nor was it accurately the same distance from the drop. The new design will have a secure place for the smartphone and that place will be above the drop instead of on the side. This stand allows for the user to move it up or down according to the smartphone in order to get a focused image each time. This new design feature is more user friendly, will allow for better accuracy in distance, captures a wider view of the drop as the view is from the top, and this setup allows for different types of cameras to be used for the same quality results.
-Step by step layout:
1. If possible, change the camera's settings so that the flash is turned off, the ISO is set to 800 or higher, the white balance is set to auto, the exposure and saturation are on the highest setting, and the contrast is on the lowest setting.
2. Place a 160 microliter drop of water in the middle of the first two rows of the slide using the pipettor so that the drop is pinned and circular.
3. Turn on the excitation light using the switch for the blue LED light.
4. Turn on your camera (preferably using the above listed settings).
5. Place your smart phone in the cradle, above the drop.
6. Adjust the distance between the camera and the drop so that the camera is as close as possible to the drop while still keeping the drop in focus.
7. Set distance between camera and drop so that it stays constant for all other photos.
8. For the other drops, first place a drop of 80 microliters of SYBR green solution then a drop of 80 microliters of the PCR DNA mix.
9. Align the drop so that the blue LED light is focused by the drop to the middle of the black fiber optic fitting on the other side of the drop.
10. Set a timer on your camera, then cover the fluorimeter and camera with the light box.
11. Make sure your camera took 3 focused images of the drop each time.
12. Remove the box but not the camera and change the drop being photographed from the side.
13. Repeat steps 8-12 for all other concentrations of calf thymus DNA.
14. Use the photos to create a calibration curve.
15. Repeat photo taking process for your own DNA samples.
