BME100 f2017:Group1 W0800 L5
OUR TEAM
 Micropipette Expert |
 Group Sass |
 Team Captain |
 Team Mascot |
 Team Sub-Captain |
 Morale |
LAB 5 WRITE-UP
PCR Report
Primers were used that targeted the piece of DNA associated with the disease. Two patient samples were given, a positive control and a negative control. Each patient sample was used to make three separate PCR mixes. Each sample was mixed with the PCR reaction mix and the primers and then put it in the thermocycler to amplify the DNA. It is expected that the positive control and the patients with the disease should have a high incidence of the DNA, because the primer was able to find the disease DNA section, and there should be a very low incidence of DNA in the negative control and the patients without the disease.
Procedure
Camera Set-Up
1. Change settings on camera
- Turn off the flash
- Set ISO to 800
- Set Exposure to highest setting (usually 2)
- Set Saturation to highest setting (if possible)
- Set Contrast to lowest setting (if possible)
(The camera we used was not able to have its saturation or contrast adjusted, and we still got good pictures.)
2. Set camera timer to 3 seconds
3. Set camera in cradle so that the drop on fluorimeter slide is in focus and that camera is as close to the drop as possible.
4. Measure distances between camera and fluorimeter and maintain that throughout the entire process.
5. Cover fluorimeter and camera in cradle with a box so that the picture is taken in darkness
Using the Fluorimeter
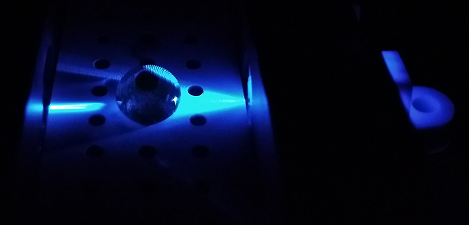
1.Turn on fluorimeter so that the blue light is on.
2. Wearing gloves, put slide into fluorimeter smooth side down.
3. With the micropipette set to 80 microliters, put a drop onto the 2 front holes in the middle of the slide of the SYBR mix.
4. Using a new tip put 80 microliters of the DNA sample onto the same drop.
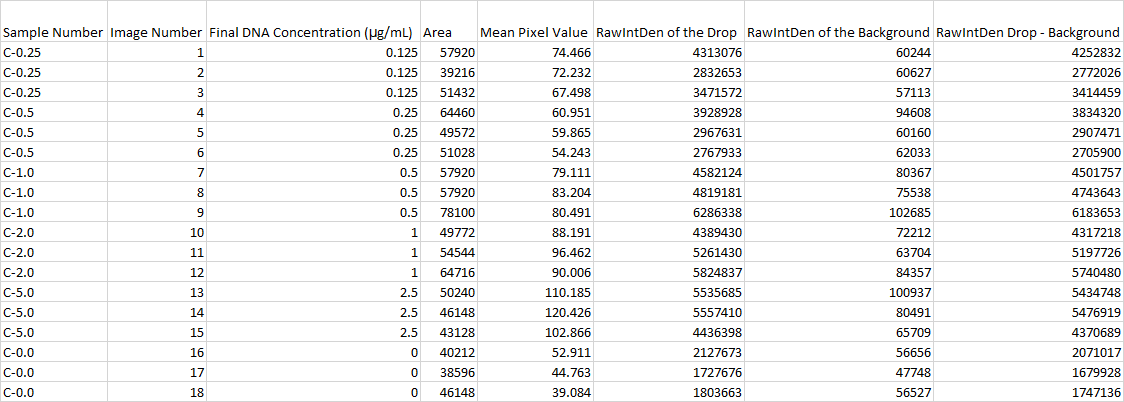
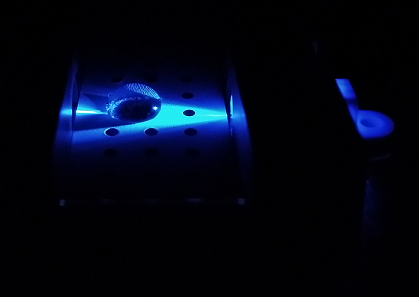
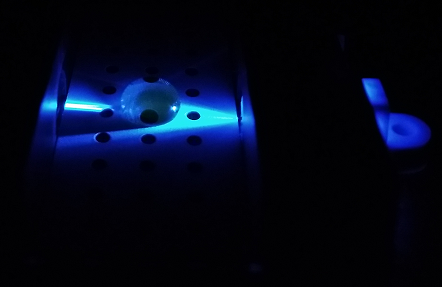
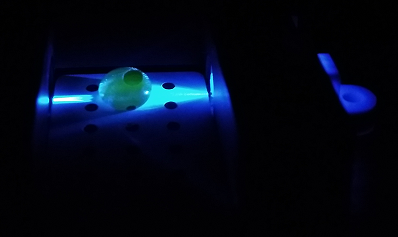
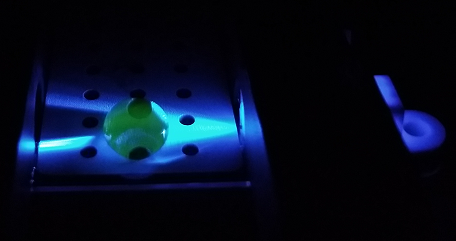
5. Take 3 pictures of this drop, making sure to label them correctly afterwards.
6. Remove drop from slide using micropipette and slide it forward so that the next two holes are at the front and repeat the procedure for the next DNA sample.
