BME100 f2017:Group14 W0800 L5
TEAM MEMBERS
 |
 |
 |
 |
 |
PCR Reaction Report
In a Polymerase Chain Reaction (PCR), a particular section of DNA is amplified and multiplied. During Lab C, we used the materials listed in the protocol from Lab A to successfully pipette the various samples and the PCR reaction mix. We had to change the labelling of our tubes to ensure that no group would have the same label. Instead of G14 as originally noted in Lab A, we used SG14 for each of the tubes. The pre-lab was extremely helpful because it reminded us how to properly pipette and outlined the steps to follow throughout the lab. When pipetting, there was little to no liquid left in the tube that the sample was taken from, implying that we correctly pipetted. The goal of the lab was to analyze PCR reactions to test the presence of a known pathogen in two different patients. We first started with an empty tube labeled as the positive control, and using proper pipetting technique, we transferred 50 μL of PCR reaction mix into the tube. Then, we transferred the positive control DNA/primer mix into the same tube using a fresh pipette tip, bringing the total volume in the tube to 100 μL. These steps were repeated for the negative control, patient 1 replicates 1, 2, and 3, and patient 2 replicates 1, 2, and 3. The primers used targeted the piece of DNA associated with the disease. Once the samples were mixed with the PCR reaction mix and the primers, they were placed into the thermocycler to heighten the segments of the targeted DNA.
Fluorimeter Procedure
Camera Set-Up
Once the slide being utilized had been adjusted (to assure that the light from the fluorimeter was illuminating the center of the drop) and the lightbox (with one flap open) was in place, the camera could be prepared. In setting up the camera (In order to capture 3 pictures of each trial), the phone being utilized to take the photos was approximately 14 cm away from the flourimeter apparatus with the flash off. Once the cradle (with the phone) were in place, the placement of the phone could be reaffirmed to confirm that the focus of the image was directly on the drop. The focus was checked once more after the flap was lowered and three pictures of the drop were manually taken. This set-up of the camera was replicated for each trial and was conducted using the 12MP camera of the Samsung Galaxy S8.
Calibration & Solutions Used for Calibration
In calibrating the flourimeter, six trials (each being captured with 3 images) were run. Each trial had utilized different concentrations (in micrograms/mL) of 2X Calf Thymus DNA solution, but each will ultimately compose a final 160 microliter drop. Before the addition of 80 microliters of SYBR GREEN I Dye solution to the 80 microliters of DNA solution, the concentrations of the 2X Calf Thymus DNA solutions (micrograms/mL) were: 0 , .25, .5, 1, 2, and 5. With the given samples of the aforementioned concentrations provided, and the flourimeter turned on, the calibration could be conducted using the method explained under the "Placing Samples Onto the Fluorimeter" section of this write-up.
Placing Samples Onto the Fluorimeter
1.Assure the samples of DNA solutions have been prepared (This includes the Calibration solutions) and the "smooth" side of the slide is facing down with the 3 X 10 grid of circles facing up.
2.Using a micropipette, set the dial to collect 80 microliters of the DNA solution.
3.Attach a new pipette tip to the micropipette, while using proper technique, and collect 80 microliters of DNA solution and place the collected sample onto the two center circles located at the bottom of the slide.
4.Once the DNA solution has been placed onto the slide, dispose of the pipette tip and attach a new tip to collect 80 microliters of the SYBR GREEN I Dye solution and place it inside the existing drop of DNA solution on the slide. What should result is a 160 microliter drop placed on the two center circles at the bottom of the slide.
5.Once again dispose of the pipette tip, readjust the slide to have the fluorimeter light hit the center of the drop, and prepare the lightbox and camera to capture 3 pictures of each trial.
6.Once the images have been captured, set the dial of the micropipette to collect 160 microliters (the entire drop) and dispose of the tip and solution properly.
Repeat the steps 1-6 for EACH TRIAL, which includes the calibration solutions and the remaining DNA solution samples. Up to FIVE trials can be conducted on ONE slide, and once that has occurred the used slide MUST be placed in the SHARPS container and a new slide should be used.
Data Collection and Analysis
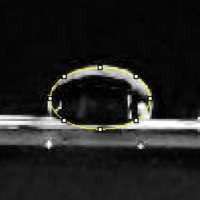
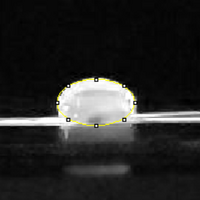
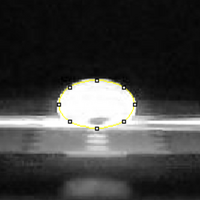
3 Calibration Drop Images
 |
 |
 |
Calibrator Raw Data
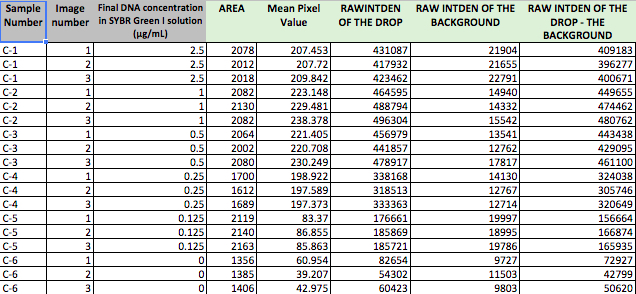
This is data from the Calibrator samples where we knew the concentration of DNA in the solution. This allowed us to determine how accurate the method of using differences in color was to determine concentration.
Calibrator Means
| Initial Concentration of 2X Calf Thymus DNA solution (µg/mL) | Final Concentration DNA concentration in SYBR Green I solution (µg/mL) | Sample # | RAWINTDEN DROP-BACK: Image 1 | RAWINTDEN DROP-BACK: Image 2 | RAWINTDEN DROP-BACK: Image 3 | MEAN | Standard Deviation |
|---|---|---|---|---|---|---|---|
| 5 | 2.5 | C-1 | 409183 | 396277 | 400671 | 402043.6667 | 6561.582837 |
| 2 | 1 | C-2 | 449655 | 474462 | 480762 | 468293 | 16445.47911 |
| 1 | 0.5 | C-3 | 443438 | 429095 | 461100 | 444544.3333 | 16031.15674 |
| 0.5 | 0.25 | C-4 | 324038 | 305746 | 320649 | 316811 | 9731.238308 |
| 0.25 | 0.125 | C-5 | 156664 | 166874 | 165935 | 163157.6667 | 5643.244664 |
| 0 | 0 | C-6 | 72927 | 42799 | 50620 | 55448.66667 | 15633.6532 |
Calibration curves
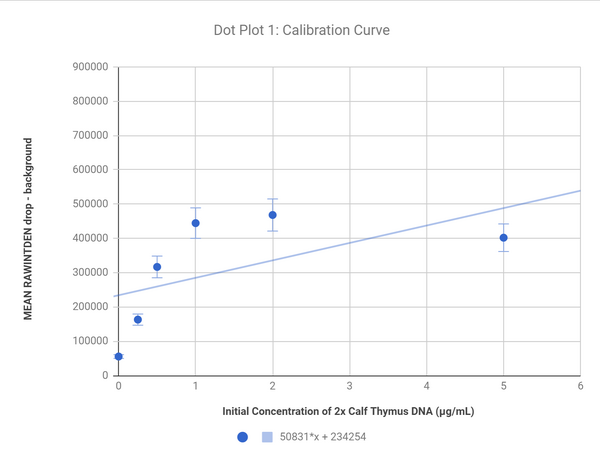
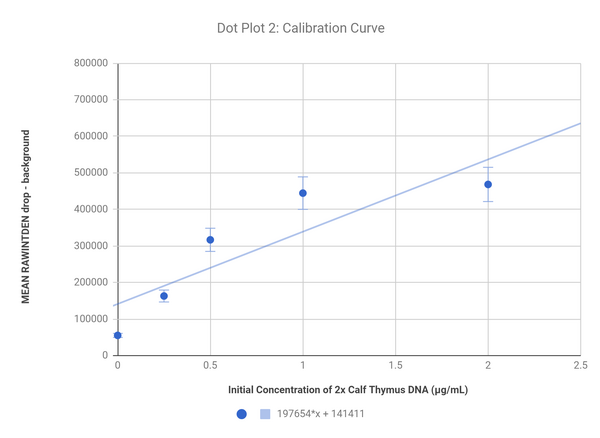
These plots show the correlation of the difference in color from the background to the bubble and the concentration of DNA; the sample with 5 2X Caf Thymus DNA solution was excluded in the second graph to create a line with a better fit as that sample was a significant outlier.
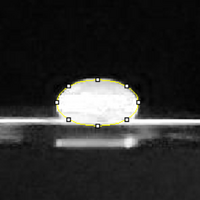
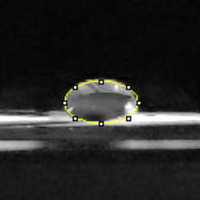
2 PCR Drop Images
 |
 |
PCR Raw Data
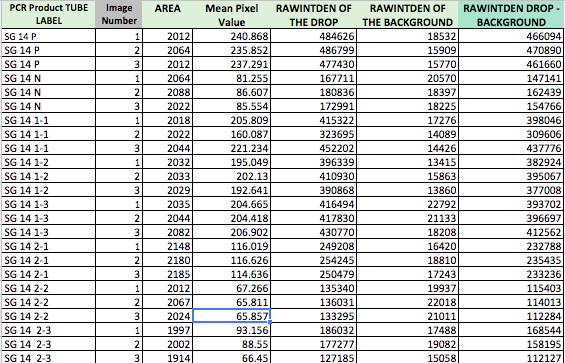
This table shows the photo analysis of two control samples, SG 14 Positive and SG 14 Negative, and 3 samples from two different patients. Using the base of the positive and negative concentrations, we can determine the similarity of both patients samples to conclude if they are positive or negative for the disease.
PCR Means
| PCR Product Tube Label | RAWINTDEN DROP-BACK: Image 1 | RAWINTDEN DROP-BACK: Image 2 | RAWINTDEN DROP-BACK: Image 3 | MEAN | Standard Deviation |
|---|---|---|---|---|---|
| SG 14 P | 466094 | 470890 | 461660 | 466214.6667 | 4616.182983 |
| SG 14 N | 147141 | 154766 | 154766 | 152224.3333 | 4402.29580 |
| SG 14 1-1 | 398046 | 309606 | 437776 | 381809.3333 | 65609.520 |
| SG 14 1-2 | 382924 | 395067 | 377008 | 384999.6667 | 9206.69128 |
| SG 14 1-3 | 393702 | 396697 | 412562 | 400987 | 10135.48099 |
| SG 14 2-1 | 232788 | 235435 | 233236 | 233819.6667 | 1416.740037 |
| SG 14 2-2 | 115403 | 114013 | 112284 | 113900 | 1562.567439 |
| SG 14 2-3 | 168544 | 158195 | 112127 | 146288.6667 | 30033.98163 |
PCR Results: PCR Concentrations Solved
| PCR Product TUBE LABEL | MEAN (of RAWINTEN DROP-BACKGROUND) | PCR Product Concentration (µg/mL) | Total Dilution | Initial PCR Product Concentration (µg/mL) |
|---|---|---|---|---|
| SG 14 + | 466214.6667 | 1.643294174 | 12 | 19.71953009 |
| SG 14 - | 152224.3333 | 0.05470839615 | 12 | 0.6565007538 |
| SG 14 1-1 | 381809.3333 | 1.216258377 | 12 | 14.59510053 |
| SG 14 1-2 | 384999.6667 | 1.232399378 | 12 | 14.78879254 |
| SG 14 1-3 | 400987 | 1.313284831 | 12 | 15.75941797 |
| SG 14 2-1 | 233819.6667 | 0.4675274301 | 12 | 5.610329161 |
| SG 14 2-2 | 113900 | -0.1391876714 | 12 | -1.670252057 |
| SG 14 2-3 | 146288.6667 | 0.02467780397 | 12 | 0.2961336477 |
Summary
The concentration of our positive sample was determined to be 19.72 µg/mL, while the negative sample was .6565 µg/mL.
Patient 1's samples had concentrations of 14.6 µg/mL, 14.79 µg/mL and 15.76 µg/mL. This is similar to the positive sample, meaning Patient 1 likely has the disease and would be positive for this test.
Patient 2"s samples had concentrations of 5.61 µg/mL, -1.67 µg/mL and .296 µg/mL. These concentrations were similar to the negative sample, meaning Patient 2 does not likely have the disease and would be negative for this test.
