BME100 f2017:Group11 W0800 L5
Our Team
 |
 |
 |
 |
 |
PCR Reactions
Two patients have each submitted three replicate DNA samples to be tested for a disease marker. The six samples, in addition to one positive and one negative control, were analyzed. To test for the disease marker, each sample of DNA was mixed with a PCR reaction mix and primers, which target the specific piece of DNA associated with the disease. The eight samples were then placed in the thermocycler to amplify the DNA. The positive control and any of the samples of the patients with the disease should have high frequency of DNA because the primer was able to find and attach to the disease DNA section, thus amplifying it. There should be a low amount of DNA amplified in the negative control and the patients' samples without the disease, because the primer was unable to attach to the disease-associated DNA piece and amplify it.
Fluorimeter Procedure
Camera Set-Up
Model: iPhone 7
1. Change settings on camera
- Turn off flash
- Set ISO to 800
- Set Exposure to highest setting (2)
- Set Saturation to highest setting (if possible)
- Set Contrast to lowest setting (if possible)
2. Set camera timer to three seconds
3. Set the camera in the cradle so that the drop on the fluorimeter slide is in focus and that the camera is as close to the drop as possible
4. Measure the distance between the fluorimeter and the camera. Maintain constant distance for every photo. (Ours was 4cm)
5. Cover the entire system (fluorimeter and camera) with the box so the picture is taken in relative darkness
Using the Fluorimeter
1. Turn on the fluorimeter so that the blue light is on
2. Place the slide into the fluorimeter smooth side down.
3. Place a 80 microliter drop of SYBR GREEN I on the first two holes in the middle rows of the slide using the micropipettor. Using a new micropipettor tip, then add 80 microliters of either the calf thymus (or water blank) solutions.
4. Take three pictures of the drop using the smartphone camera procedure described above. Make sure to document the images correctly afterwards.
5. Remove the drops from the slide using the micropipettor. Move the slide forward so the next two holes are at the front and repeat steps 2-5 for the next DNA sample.
Data Analysis
Table 1: PCR Raw Data
| Sample Number | Image Number | Final DNA Concentration | Area | Mean Pixel Value | RawIntDen of the Drop | RawIntDen of the Background | Minimun | Maximum | Color |
| 1 | 1 | 0.125 | 46504 | 135.441 | 6298558 | 175878457 | 25 | 255 | None |
| 1 | 2 | 0.125 | 42528 | 127.022 | 5401981 | 165393967 | 37 | 255 | None |
| 1 | 3 | 0.125 | 47044 | 143.201 | 6736742 | 197932480 | 48 | 255 | None |
| 2 | 1 | 0.25 | 69476 | 131.232 | 8828402 | 1890958259 | 8 | 255 | Green |
| 2 | 2 | 0.25 | 65444 | 143.902 | 9417545 | 181485250 | 32 | 255 | Green |
| 2 | 3 | 0.25 | 62180 | 139.062 | 8645893 | 186035957 | 11 | 255 | Green |
| 3 | 1 | 0.5 | 73968 | 158.401 | 11716623 | 219467452 | 27 | 255 | None |
| 3 | 2 | 0.5 | 80252 | 158.168 | 12693271 | 200502424 | 43 | 255 | None |
| 3 | 3 | 0.5 | 80185 | 150.751 | 12087944 | 199536625 | 33 | 255 | None |
| 4 | 1 | 1 | 105792 | 128.667 | 13611992 | 134825536 | 15 | 255 | None |
| 4 | 2 | 1 | 116248 | 125.272 | 14562663 | 126905865 | 15 | 255 | None |
| 4 | 3 | 1 | 114692 | 128.927 | 14786851 | 128998070 | 14 | 255 | None |
| 5 | 1 | 2.5 | 108572 | 119.377 | 12960969 | 147753261 | 27 | 255 | None |
| 5 | 2 | 2.5 | 103184 | 116.355 | 12005943 | 141339941 | 19 | 255 | None |
| 5 | 3 | 2.5 | 107328 | 117.294 | 12588935 | 140756949 | 20 | 255 | None |
| 6 | 1 | 0 | 80596 | 154.013 | 12729926 | 109203822 | 39 | 255 | Green |
| 6 | 2 | 0 | 123208 | 151.694 | 18689945 | 128893087 | 30 | 255 | Green |
| 6 | 3 | 0 | 73032 | 154.514 | 11284471 | 99827747 | 48 | 255 | Green |
| 7 | 1 | 0 | 137412 | 86.805 | 11928032 | 166099184 | 18 | 255 | None |
| 7 | 2 | 0 | 135032 | 87.46 | 11809964 | 158043551 | 19 | 255 | None |
| 7 | 3 | 0 | 135284 | 90.478 | 12240209 | 167824147 | 10 | 255 | None |
| 8 | 1 | 0 | 82360 | 142.918 | 11823742 | 177234556 | 17 | 255 | None |
| 8 | 2 | 0 | 86848 | 148.175 | 12868732 | 176300973 | 20 | 255 | None |
| 8 | 3 | 0 | 71268 | 148.344 | 10572213 | 17866576 | 55 | 255 | None |
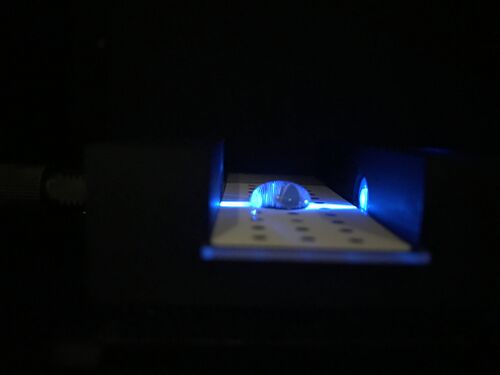
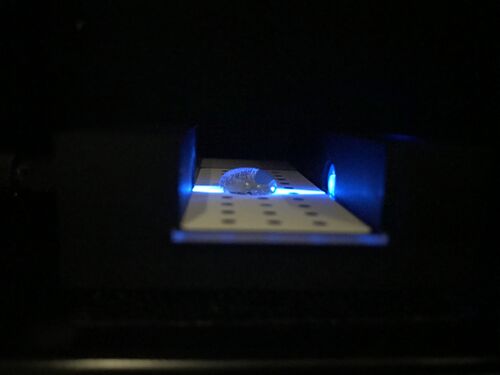
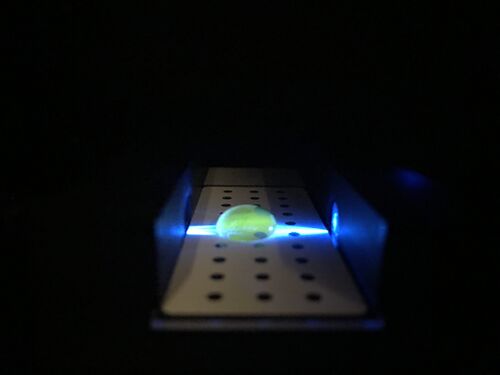
Pictures of Thymus DNA at 0,0.25, and 1.0

|

|

|